Page 151 - NUMINO TB_3B
P. 151
179_G3U31_G3U22˙—» ¿º 2011.3.23 11:42 AM ˘ ` 140 PDF_In 2540DPI 150LPI T
Activity 3 Use Graphs
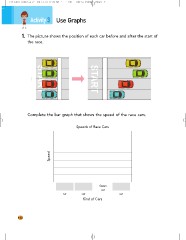
1 . The picture shows the position of each car before and after the start of
the race.
Complete the bar graph that shows the speed of the race cars.
Speeds of Race Cars
Speed
Green
car
car car car
Kind of Cars
140
Activity 3 Use Graphs
1 . The picture shows the position of each car before and after the start of
the race.
Complete the bar graph that shows the speed of the race cars.
Speeds of Race Cars
Speed
Green
car
car car car
Kind of Cars
140