Page 154 - NUMINO TB_3B
P. 154
179_G3U31_G3U22˙—» ¿º 2011.3.23 11:43 AM ˘ ` 143 PDF_In 2540DPI 150LPI T
Challenge Circle Graphs
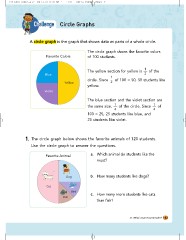
A circle graph is the graph that shows data as parts of a whole circle.
Favorite Colors The circle graph shows the favorite colors
of 100 students.
Blue The yellow section for yellow is 1 of the
Violet 2
1
Yellow circle. Since 2 of 100 = 50, 50 students like
yellow.
The blue section and the violet section are
the same size, 1 of the circle. Since 1 of
44
100 = 25, 25 students like blue, and
25 students like violet.
1 . The circle graph below shows the favorite animals of 120 students.
Use the circle graph to answer the questions.
Favorite Animal a. Which animal do students like the
most?
Dog b. How many students like dogs?
Cat c. How many more students like cats
Bird than fish?
Fish
31. What’s Your Favorite Color? 143
Challenge Circle Graphs
A circle graph is the graph that shows data as parts of a whole circle.
Favorite Colors The circle graph shows the favorite colors
of 100 students.
Blue The yellow section for yellow is 1 of the
Violet 2
1
Yellow circle. Since 2 of 100 = 50, 50 students like
yellow.
The blue section and the violet section are
the same size, 1 of the circle. Since 1 of
44
100 = 25, 25 students like blue, and
25 students like violet.
1 . The circle graph below shows the favorite animals of 120 students.
Use the circle graph to answer the questions.
Favorite Animal a. Which animal do students like the
most?
Dog b. How many students like dogs?
Cat c. How many more students like cats
Bird than fish?
Fish
31. What’s Your Favorite Color? 143