
Page 9 - Organico Realfoods Carbon Report
P. 9
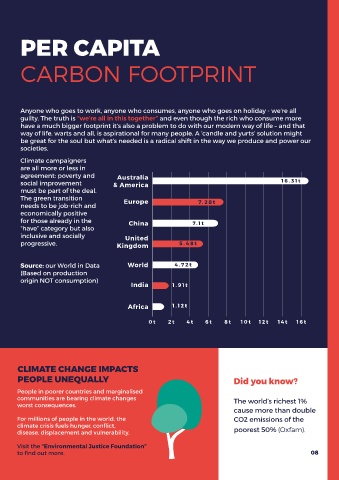
THE BIG PICTURE:   PER CAPITA


 WHOSE FAULT IS IT   CARBON FOOTPRINT


 ANYWAY?


        Anyone who goes to work, anyone who consumes, anyone who goes on holiday - we’re all
        guilty. The truth is “we’re all in this together” and even though the rich who consume more
        have a much bigger footprint it’s also a problem to do with our modern way of life – and that
 CUMULATIVE HISTORIC GLOBAL EMISSIONS  CURRENT EMISSIONS: 36.2BN IN 2017  way of life, warts and all, is aspirational for many people. A ‘candle and yurts’ solution might
 1751 TO 2017  be great for the soul but what’s needed is a radical shift in the way we produce and power our
        societies.
 600  20
 18     Climate campaigners
 500  16  are all more or less in

 457bn Co2  14  agreement: poverty and    Australia                                                 1 6 . 3 1t
 400    social improvement               & America
 514bn Co2
 of which  12  must be part of the deal.
 399bn
 of which  19bn Co2
 300  353bn  USA  10  The green transition   Europe                    7. 2 8 t
 EU27 + UK  8  of which  needs to be job-rich and
 9.2bn
 200  457bn Co2  6  6.5bn Co2  CHINA  economically positive
 of which  for those already in the           China                  7. 1 t
 200bn  4  6.1bn Co2   of which  “have” category but also
 100  CHINA  of which  5.3bn  4.6bn Co2
 USA
 2  3.5bn  inclusive and socially            United
 43bnCo2  EU27 + UK  progressive.         Kingdom               5 . 4 8t
 0  0
 Europe  North  Asia  Rest of  Europe  North  Asia  Rest of
 America  World  America  World
        Source: our World in Data             World           4 .7 2 t
        (Based on production
 SOURCE OUR WORLD IN DATA  origin NOT consumption)
                                               India          1 . 9 1t


                                              Africa          1 .1 2 t


 UK FOOTPRINT  Explainer: we’re in a global          0t     2t     4t    6t     8t    10 t  12 t   14 t  16 t

 trade world. CO2/footprint country
 comparisons are normally shown
 on a production basis but on a
 54%   consumption basis almost ½ the

 Domestic  UK footprint is from products   CLIMATE CHANGE IMPACTS
 manufactured abroad.
       PEOPLE UNEQUALLY                                                            Did you know?

       People in poorer countries and marginalised
 46%   communities are bearing climate changes                                     The world’s richest 1%
       worst consequences.
 Imports                                                                           cause more than double

 Source: WWF Exploring the   For millions of people in the world, the              CO2 emissions of the
       climate crisis fuels hunger, conflict,
 UK’s Contribution to Climate   disease, displacement and vulnerability.           poorest 50% (Oxfam).
 Change March 2020).
       Visit the “Environmental Justice Foundation”
 07    to find out more.                                                                                      08