
Page 5 - PDF
P. 5
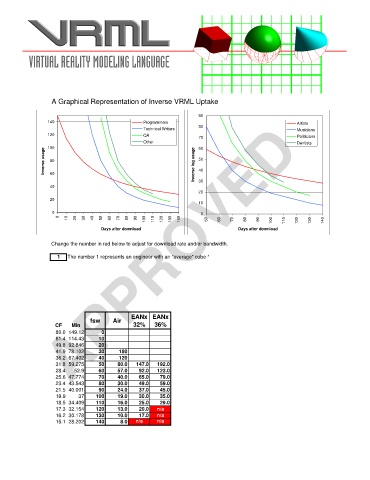
A Graphical Representation of Inverse VRML Uptake

                                                                   90
                        APPROVED
                 140                            Programmers                                        Artists
                                                Technical Writers  80                              Musicians
                 120                            QA                 70                              Politicians
                                                Other              60                              Dentists
                 100
                Inverse usage  80                                Inverse log usage  50


                                                                   40
                  60
                  40                                               30
                                                                   20
                  20
                                                                   10
                  0                                                0
                    0  10  20  30  40  50  60  70  80  90  100  110  120  130  140  50  60  70  80  90  100  110  120  130  140

                                   Days after download                          Days after download

                  Change the number in red below to adjust for download rate and/or bandwidth.
                    1  The number 1 represents an engineer with an "average" cube *


                                            EANx EANx
                               fsw    Air
                   CF    Min                 32%    36%
                   80.0 149.12     0
                   61.4 114.43    10
                   49.8 92.846    20
                   41.9 78.102    30    180
                   36.2 67.402    40    120
                   31.8 59.275    50    80.0  147.0  192.0
                   28.4   52.9    60    57.0   92.0  123.0
                   25.6 47.774    70    40.0   65.0   79.0
                   23.4 43.543    80    30.0   49.0   59.0
                   21.5 40.001    90    24.0   37.0   45.0
                   19.9    37    100    19.0   30.0   35.0
                   18.5 34.409   110    16.0   25.0   29.0
                   17.3 32.154   120    13.0   20.0  n/a
                   16.2 30.178   130    10.0   17.0  n/a
                   15.1 28.202   140     8.0  n/a    n/a