
Page 61 - ro membanes
P. 61
44 3. DIAGNOSTICS OF MEMBRANE FOULING AND SCALING
reliably produce permeate of target design flow rate and quality while minimizing operational expenditures for energy and for cleaning and replacement of membrane elements. Membrane fouling has direct impact on all plant-performance goals because it decreases RO system’s freshwater production flow over time; increases energy needed to produce target freshwater flow; and accelerates the need for membrane cleaning and replacement. As indicated in Chapter 2, membrane fouling is a complex phenomenon often caused by a combination of foulantsdparticulate, colloidal, mineral scale, natural organics, and microbial biofilm.
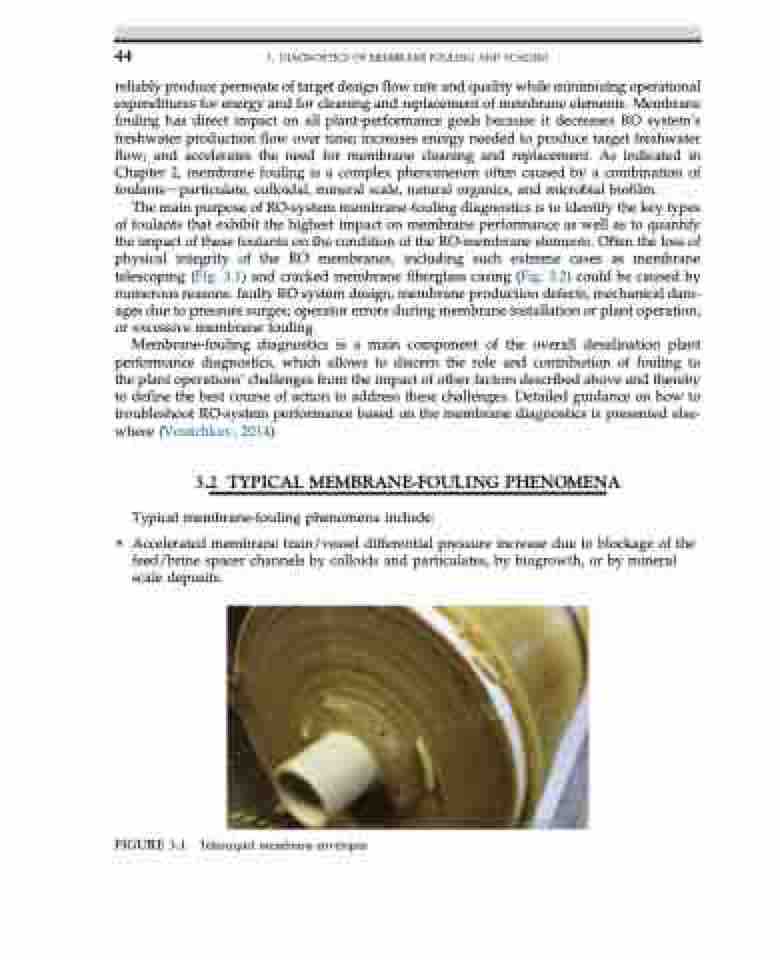
The main purpose of RO-system membrane-fouling diagnostics is to identify the key types of foulants that exhibit the highest impact on membrane performance as well as to quantify the impact of these foulants on the condition of the RO-membrane elements. Often the loss of physical integrity of the RO membranes, including such extreme cases as membrane telescoping (Fig. 3.1) and cracked membrane fiberglass casing (Fig. 3.2) could be caused by numerous reasons: faulty RO system design; membrane production defects; mechanical dam- ages due to pressure surges; operator errors during membrane installation or plant operation; or excessive membrane fouling.
Membrane-fouling diagnostics is a main component of the overall desalination plant performance diagnostics, which allows to discern the role and contribution of fouling to the plant operations’ challenges from the impact of other factors described above and thereby to define the best course of action to address these challenges. Detailed guidance on how to troubleshoot RO-system performance based on the membrane diagnostics is presented else- where (Voutchkov, 2014).
3.2 TYPICAL MEMBRANE-FOULING PHENOMENA
Typical membrane-fouling phenomena include:
• Accelerated membrane train/vessel differential pressure increase due to blockage of the feed/brine spacer channels by colloids and particulates, by biogrowth, or by mineral scale deposits.
FIGURE 3.1 Telescoped membrane envelopes.
