
Page 888 - Algebra 1
P. 888
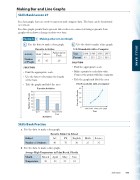
Making Bar and Line Graphs
Skills Bank Lesson 27
In a bar graph, bars are used to represent and compare data. The bars can be horizontal or vertical.
In a line graph, points that represent data values are connected using segments. Line graphs often show a change in data over time.
Making a Bar or Line Graph
Example
1
a. Use the data to make a bar graph. Favorite Activities
SOLUTION
• Findtheappropriatescale.
• Usethedatatodeterminethelength of the bars.
• Titlethegraphandlabeltheaxes.
b. Use the data to make a line graph. U.S. Households with a Computer
SOLUTION
• Find the appropriate scale.
• Makeapointforeachdatavalue. Connect the points with line segments.
• Title the graph and label the axes.
Activity
Golf
Movie
Amusement Park
Number of People
35
45
20
Year
1984
1989
1993
1997
Percent
8%
15%
22%
36%
U.S. Households with a Computer
40 30 20 10
0
60
50
40
30
20
10
0
Favorite Activities
Golf
Movie Amusement Park
Activities
1980 1985 1990 1995 2000
Year
Skills Bank Practice
a. Use the data to make a bar graph.
Favorite Subject in School
b. Use the data to make a line graph.
Average High Temperature in Palm Beach, Florida
Subject
Art
PE
English
Math
Science
Number of Students
40
70
30
25
35
Month
March
April
May
June
Temperature
80
83
85
88
Skills Bank 873
SKILLS BANK
Number of People
Percent of People
