
Page 889 - Algebra 1
P. 889
Making Circle Graphs
Skills Bank Lesson 28
A circle graph compares part of the data set to the whole set of data.
In a circle graph, data is displayed as sections of a circle. Each section has an angle at the center. The total measure of the angles at the center of the circle is 360°. The entire circle represents all of the data.
Making a Circle Graph
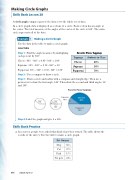
Use the data in the table to make a circle graph.
SOLUTION
Step 1: Find the angle measures by multiplying Favorite Pizza Toppings each percent by 360°.
Cheese: 40% · 360° = 0.40 · 360° = 144° Supreme: 10% · 360° = 0.10 · 360° = 36° Pepperoni: 50% · 360° = 0.50 · 360° = 180° Step2: Useacompasstodrawacircle.
Step 3: Draw a circle and radius with a compass and straightedge. Then use a protractor to draw the first angle, 144°. Then draw the second and third angles, 36° and 180°.
Example
1
Toppings
Students in Class
Cheese
40%
Supreme
10%
Pepperoni
50%
Favorite Pizza Toppings
144°
144° 180°
Supreme 10%
Cheese 40%
Pepperoni 50%
36°
Step 4: Label the graph and give it a title.
Skills Bank Practice
a. In a survey, people were asked what kind of pet they owned. The table shows the results of the survey. Use the table to make a circle graph.
Pet Owners
Dog
36%
Cat
25%
Fish
15%
No pets
24%
874 Saxon Algebra 1
24% No Pet
15% Fish
25% Cat
