
Page 891 - Algebra 1
P. 891
Venn Diagrams
Skills Bank Lesson 30
A Venn diagram shows the relationship between sets. Making a Venn Diagram
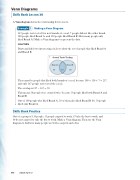
167 people taste tested two new brands of cereal. 7 people did not like either brand, 100 people liked Brand A, and 110 people liked Brand B. How many people only liked Brand A? Make a Venn diagram to represent the data.
SOLUTION
Draw and label two intersecting circles to show the set of people that liked Brand A and Brand B.
There must be people that liked both brands of cereal, because 100 + 110 + 7 = 217, and only 167 people taste tested the cereal.
The overlap is 217 - 167 = 50.
This means 50 people were counted twice because 50 people liked both Brand A and
Brand B.
Out of 100 people who liked Brand A, 50 of them also liked Brand B. So, 50 people liked only Brand A.
Skills Bank Practice
Out of a group of 133 people, 55 people carpool to work, 67 take the bus to work, and 30 do not carpool or take the bus to work. Make a Venn diagram. Then use the Venn diagram to find how many people use both a carpool and a bus.
Example
1
876 Saxon Algebra 1
7
Cereal Taste Testing
Brand A Brand B 50 50 60
