
Page 12 - DDS Annual Report FY 2019
P. 12
DDS ACHIEVEMENTS
ANNUAL
REPORT
2019
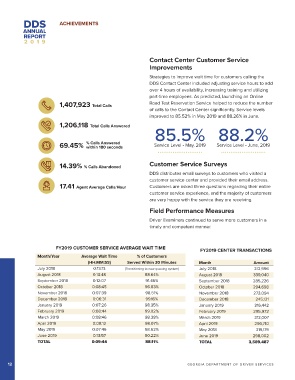
1,407,923 Total Calls Contact Center Customer Service
Improvements
1,206,118 Total Calls Answered
Strategies to improve wait time for customers calling the
69.45% % Calls Answered DDS Contact Center included adjusting service hours to add
within 180 seconds over 4 hours of availability, increasing training and utilizing
part-time employees. As predicted, launching an Online
14.39% % Calls Abandoned Road Test Reservation Service helped to reduce the number
of calls to the Contact Center significantly. Service levels
17.41 Agent Average Calls/Hour improved to 85.52% in May 2019 and 88.26% in June.
85.5% 88.2%
Service Level - May, 2019 Service Level - June, 2019
Customer Service Surveys
DDS distributes email surveys to customers who visited a
customer service center and provided their email address.
Customers are asked three questions regarding their entire
customer service experience, and the majority of customers
are very happy with the service they are receiving.
Field Performance Measures
Driver Examiners continued to serve more customers in a
timely and competent manner.
FY2019 CUSTOMER SERVICE AVERAGE WAIT TIME FY2019 CENTER TRANSACTIONS
Month/Year Average Wait Time % of Customers Month Amount
(HH:MM:SS) Served Within 30 Minutes
July 2018 0:13:13 July 2018 312,996
August 2018 0:13:48 (Transitioning to new queuing system)
September 2018 0:12:07 August 2018 339,040
October 2018 0:08:45 88.64%
November 2018 0:07:39 91.46% September 2018 285,226
December 2018 0:06:31 96.83%
January 2019 0:07:26 98.51% October 2018 294,698
February 2019 0:08:44 99.16%
March 2019 0:08:46 98.35% November 2018 273,094
April 2019 0:08:12 99.02%
May 2019 0:07:46 98.38% December 2018 245,121
June 2019 0:13:57 98.07%
TOTAL 0:09:44 98.62% January 2019 316,442
90.22%
88.11% February 2019 295,972
March 2019 313,007
April 2019 296,710
May 2018 319,179
June 2019 298,002
TOTAL 3,589,487
12 G E O R G I A D E PA R T M E N T O F D R I V E R S E R V I C E S