
Page 28 - 2019 Annual Report Final PDF_Neat
P. 28
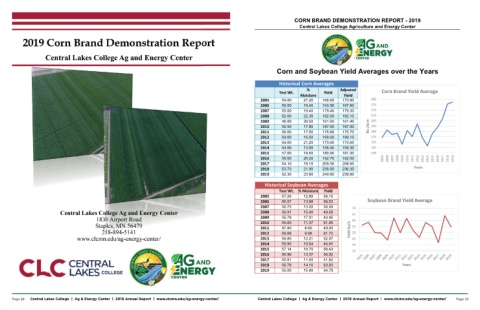
Corn and Soybean Yield Averages over the Years
                                                 Corn Brand Yield Average           2019  2018  2017  2016  2015  2014  2013  2012  2011  2010  2009  2008  2007  Years  Soybean Brand Yield Average  Years


            CORN BRAND DEMONSTRATION REPORT - 2019
               Central Lakes College Agriculture and Energy Center


                                                    245  235  225  215  205  195  185  Bu./Acre  175  165  155  145  2006  2005                           Central Lakes College  |  Ag & Energy Center  |  2019 Annual Report  |  www.clcmn.edu/ag-energy-center/         Page 33


                                                Adjusted   Yield  Yield  173.80  166.60  187.80  193.90  179.30  179.40  182.10  182.00  161.40  161.50  187.00  187.00  175.70  175.80  199.10  199.00  173.60  173.60  158.30  158.40  181.30  180.90  192.50  192.70  208.60  209.50  236.30  236.60  239.80  240.80  Yield  56.15  58.53  50.09  70  49.69  65  43.95  60  61.95  55  49.93  50  61.72  Yield bu/A  45  52.07  46.01  40  58.43  35  54.92  41.82  63.93  54.70


                                             Historical Corn Averages  %   Test Wt.  Moisture  21.20  54.00  19.40  56.00  19.40  55.00  22.30  52.00  30.50  48.00  17.80  56.50  17.00  56.00  15.50  59.00  21.20  54.00  13.90  54.00  18.60  57.00  20.20  55.00  19.10  54.10  21.90  53.70  23.80  52.30  Historical Soybean Averages  % Moisture  Test Wt.  12.89  57.26  13.88  56.57  13.00  56.75  15.49  56.91  17.01  55.78  11.37  56.60  8.60  57.80  9.98  56.68  12.21  56.85  10.54  55.95  10.70  57.14  13.37  56.98  11.60  55.81  14.16  56.78  15.90  55.00


                                                     2005  2006  2007  2008  2009  2010  2011  2012  2013  2014  2015  2016  2017  2018  2019  2005  2006  2007  2008  2009  2010  2011  2012  2013  2014  2015  2016  2017  2018  2019


                                                                                                                                                          Page 28        Central Lakes College  |  Ag & Energy Center  |  2019 Annual Report  |  www.clcmn.edu/ag-energy-center/