
Page 29 - 2019 Annual Report Final PDF_Neat
P. 29
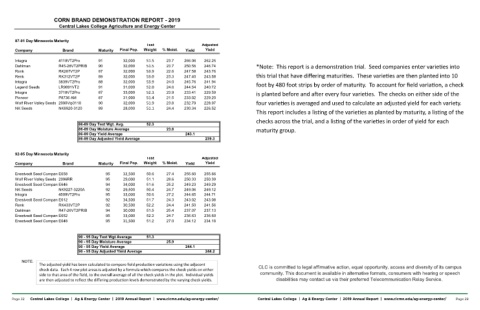
foot by 480 foot strips by order of maturity.  To account for field varia on, a check
                                                           This report includes a lis ng of the varie es as planted by maturity, a lis ng of the
                                                       four varie es is averaged and used to calculate an adjusted yield for each variety.
                                    *Note:  This report is a demonstra on trial.  Seed companies enter varie es into
                                                  is planted before and a er every four varie es.  The checks on either side of the
                                         this trial that have differing maturi es.  These varie es are then planted into 10
                                                                checks across the trial, and a lis ng of the varie es in order of yield for each


                                                                     maturity group.                                                      CLC is committed to legal affirmative action, equal opportunity, access and diversity of its campus  community. This document is available in alternative formats, consumers with hearing or speech  disabilities may contact us via their preferred Telecommunication Relay Service.     Central Lakes College  |  Ag & Energy Center  |  2019 Annual Report  |  www.clcmn.edu/ag-energy-center/         Page 29


                        Adjusted   Yield  262.25  246.74  243.76  243.58  241.94  240.72  229.59  229.20  228.97  226.52  239.3  Adjusted   Yield  255.66  250.39  249.29  249.12  244.71  243.08  241.56  237.13  236.69  234.18  244.2


                           Yield  266.06  250.56  247.58  247.40  245.76  244.54  233.41  233.02  232.79  230.34  243.1  Yield  255.60  250.33  249.23  249.06  244.65  243.02  241.50  237.07  236.63  234.12  244.1


            CORN BRAND DEMONSTRATION REPORT - 2019
                           % Moist.  23.7  23.7  22.6  23.3  24.0  24.6  23.9  21.5  23.8  24.4  23.6  % Moist.  27.4  28.6  25.2  24.7  27.2  24.3  24.4  25.4  24.7  27.0  25.9
               Central Lakes College Agriculture and Energy Center


                        Test   Weight  51.5  51.5  53.9  53.0  53.9  52.0  52.3  51.4  51.9  51.1  52.3  Test   Weight  50.6  51.1  51.6  50.4  50.6  51.7  52.2  51.5  52.2  51.2  51.3


                           Final Pop.  32,000  32,000  32,000  32,000  32,000  31,000  33,000  31,000  32,000  28,000  Final Pop.  32,500  29,000  34,000  29,500  33,000  34,500  30,500  30,000  33,000  31,500  has been calculated to compare field production variations using the adjacent  check data.  Each 4 row plot areas is adjusted by a formula which compares the check yields on either  side to that area of the field, to the overall average of all the check yields in the plot.  Individual yields  are then adjusted to reflect the differing production levels demonstrated by the varying check yields.        Central Lakes Col


                           Maturity  91  90  87  89  88  91  87  87  90  89  86-89 Day Test Wgt. Avg. 86-89 Day Moisture Average 86-89 Day Yield Average 86-89 Day Adjusted Yield Average  Maturity  95  95  94  92  95  92  92  94  95  95  90 - 95 Day Test Wgt Average 90 - 95 Day Moisture Average 90 - 95 Day Yield Average 90 - 95 Day Adjusted Yield Average


                      87-91 Day Minnesota Maturity  Brand Company  4119VT2Pro  Integra  R45-28VT2PRIB  Dahlman  RK287VT2P  Renk  RK312VT2P  Renk  3839VT2Pro  Integra  LR9891VT2 Legend Seeds  3718VT2Pro  Integra  P8736 AM  Pioneer  2090Vip3110 Wolf River Valley Seeds  NK8920-3120  NK Seeds  92-95 Day Minnesota Maturity  Brand Company  E658 Enestvedt Seed Company  2096RR Wolf River Valley Seeds  E646 Enestvedt Seed Company  NK9227-3220A  NK Seeds  4509VT2Pro  Integra  E612 Enestvedt Seed Company  RK433VT2P  Renk  R47-26VT2PRIB  Dahlman  E652 Enestvedt Seed Company  E648 Enestvedt Seed Company  NOTE:  The adjusted yield  Page 3