
Page 13 - CNB Bank Shares 2018 Annual Report
P. 13
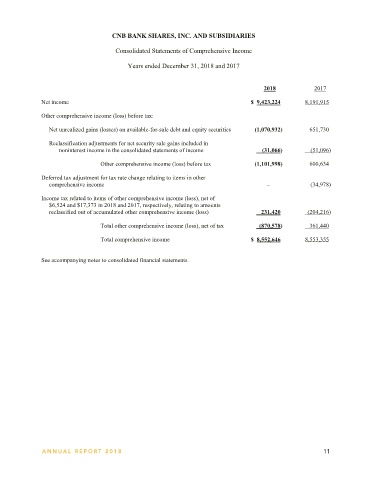
CNB BANK SHARES, INC. AND SUBSIDIARIES   CNB BANK SHARES, INC. AND SUBSIDIARIES

 Consolidated Statements of Income     Consolidated Statements of Comprehensive Income

 Years ended December 31, 2018 and 2017    Years ended December 31, 2018 and 2017


       2018   2017                                                                      2018             2017
 Interest income:
    Interest and fees on loans (note 4)   $  43,485,700   34,432,532   Net income      $  9,423,224   8,191,915
    Interest and dividends on debt and equity securities:
      Taxable      3,053,742   2,159,438   Other comprehensive income (loss) before tax:
      Exempt from federal income taxes   2,362,985   1,792,681
    Interest on short-term investments      736,962      464,968      Net unrealized gains (losses) on available-for-sale debt and equity securities   (1,070,932)   651,730
           Total interest income   49,639,389   38,849,619
 Interest expense:      Reclassification adjustments for net security sale gains included in
    Interest on deposits (note 6)    8,273,617   5,325,417          noninterest income in the consolidated statements of income     (31,066)     (51,096)
    Interest on short-term borrowings (note 8)   241,595   66,607
    Interest on longer-term Federal Home Loan Bank borrowings (note 9)   357,595   204,913            Other comprehensive income (loss) before tax     (1,101,998)   600,634
    Interest on notes payable (note 10)      249,025      87,037
          Total interest expense           9,121,832     5,683,974   Deferred tax adjustment for tax rate change relating to items in other
          Net interest income      40,517,557   33,165,645      comprehensive income      −            (34,978)
 Provision for possible loan losses (note 4)           3,101,114     2,254,528
          Net interest income after provision   Income tax related to items of other comprehensive income (loss), net of
          for possible loan losses         37,416,443   30,911,117        $6,524 and $17,373 in 2018 and 2017, respectively, relating to amounts        231,420     (204,216)
                 reclassified out of accumulated other comprehensive income (loss)
 Noninterest income:
    Service charges on deposit accounts   1,775,060   1,321,266            Total other comprehensive income (loss), net of tax     (870,578)     361,440
    Card-based revenue     1,448,937   1,033,566
    Income from fiduciary activities   1,134,594   1,253,545            Total comprehensive income   $  8,552,646   8,553,355
    Mortgage banking revenues   1,423,936   1,191,233
    Increase in cash surrender value of life insurance policies   153,621   113,201
    Net gains on sales of investment securities (note 3)   31,066   51,096   See accompanying notes to consolidated financial statements.
    Other noninterest income (note 5)        2,091,169      841,166
          Total noninterest income        8,058,383     5,805,073
 Noninterest expense:
    Salaries and employee benefits (notes 11 and 12)   18,666,151   13,655,441
    Occupancy and equipment expense (note 5)   4,137,096   3,232,416
    Legal and professional fees   3,087,661   730,789
    Postage, printing, and supplies   702,376   506,876
    Amortization of intangible assets   832,840   602,833
    Other real estate owned expense   98,669   146,125
    Advertising expense     786,299   733,679
    FDIC insurance assessments   610,670   554,000
    Other noninterest expense        4,228,349     3,071,311
          Total noninterest expense      33,150,111   23,233,470
          Income before applicable income taxes   12,324,715   13,482,720
 Applicable income tax expense (note 7)        2,901,491     5,290,805
          Net income        $    9,423,224     8,191,915


 See accompanying notes to consolidated financial statements.


 10  ANNUAL REPOR T 2018  ANNUAL REPOR T 2018                                                               11