Page 14 - CNB Bank Shares 2018 Annual Report
P. 14

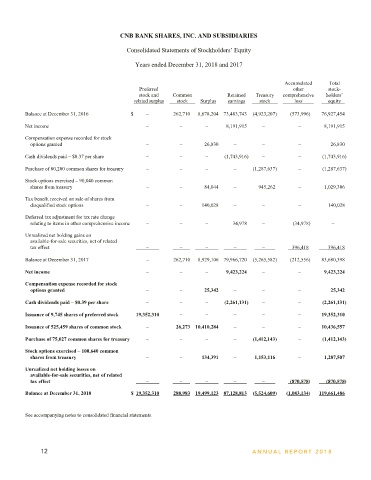
CNB BANK SHARES, INC. AND SUBSIDIARIES                                                                                   CNB BANK SHARES, INC. AND SUBSIDIARIES

                                           Consolidated Statements of Stockholders’ Equity                                                                               Consolidated Statements of Cash Flows

                                              Years ended December 31, 2018 and 2017                                                                                    Years ended December 31, 2018 and 2017

                                                                                                                                                                                                                    2018          2017
                                                                                               Accumulated   Total                       Cash flows from operating activities:
                                               Preferred                                          other      stock-                         Net income                                                         $  9,423,224    8,191,915
                                               stock and   Common           Retained   Treasury   comprehensive   holders’
                                             related surplus     stock     Surplus   earnings      stock        loss         equity         Adjustments to reconcile net income to net cash
                                                                                                                                               provided by operating activities:
         Balance at December 31, 2016       $    −        262,710   8,678,204  73,483,743  (4,923,207)   (573,996)   76,927,454                   Depreciation and amortization                                   2,586,798    3,116,283
                                                                                                                                                  Provision for possible loan losses                              3,101,114    2,254,528
         Net income                              −          −        −      8,191,915   −          −        8,191,915                             Net security sale gains                                          (31,066)      (51,096)
                                                                                                                                                  Net cash gains on sales of mortgage loans in secondary market   (414,873)     (388,793)
         Compensation expense recorded for stock                                                                                                  Capitalized mortgage servicing rights                           (281,497)     (242,195)
           options granted                       −          −       26,830    −        −           −          26,830
                                                                                                                                                  Net losses (gains) and write-downs on sales of other real estate owned   (55,461)   120,174
         Cash dividends paid – $0.37 per share   −          −        −     (1,743,916)   −         −       (1,743,916)                            Deferred income tax expense (benefit)                             (5,497)      812,845
                                                                                                                                                  Stock option expense                                              25,342        26,830
         Purchase of 80,200 common shares for treasury   −   −       −        −     (1,287,637)    −       (1,287,637)                            Increase in accrued interest receivable                         (685,063)     (613,384)
                                                                                                                                                  Increase in accrued interest payable                             537,808       245,407
         Stock options exercised – 90,040 common                                                                                                  Mortgage loans originated for sale in secondary market        (32,741,956)   (24,366,704)
           shares from treasury                  −          −       84,044    −       945,262      −        1,029,306                             Proceeds from mortgage loans sold in secondary market          33,407,409   24,608,293

         Tax benefit received on sale of shares from                                                                                              Increase in cash surrender value of life insurance policies,
           disqualified stock options            −          −       140,028   −        −           −         140,028                                 net of mortality costs                                       (155,618)     (113,201)
                                                                                                                                                  Other operating activities, net                                 (5,297,975)     1,270,103
         Deferred tax adjustment for tax rate change                                                                                                    Net cash provided by operating activities                  9,412,689   14,871,005
           relating to items in other comprehensive income   −   −   −        34,978   −          (34,978)    −                          Cash flows from investing activities:
                                                                                                                                            Net cash paid for acquisition of subsidiary                         (30,044,491)       −
         Unrealized net holding gains on
           available-for-sale securities, net of related                                                                                    Proceeds from calls and maturities of and principal
           tax effect                            −            −        −        −         −        396,418      396,418                        payments on available-for-sale debt securities                    23,711,851   23,489,472
                                                                                                                                            Purchases of available-for-sale debt and equity securities           (6,741,403)   (25,685,246)
         Balance at December 31, 2017            −        262,710   8,929,106  79,966,720  (5,265,582)   (212,556)   83,680,398             Proceeds from sales of available-for-sale debt securities            23,648,022    1,949,892
                                                                                                                                            Redemption of Federal Home Loan Bank stock                             640,773       806,054
         Net income                              −          −        −      9,423,224   −          −        9,423,224                       Net increase in loans                                               (35,832,467)   (26,022,879)
                                                                                                                                            Purchases of bank premises and equipment, net                        (1,106,640)    (926,032)
         Compensation expense recorded for stock
           options granted                       −          −       25,342    −        −           −          25,342                        Proceeds from sale of other real estate owned                          400,007       214,410
                                                                                                                                            Proceeds from redemption of life insurance contract                      −            50,000
         Cash dividends paid – $0.39 per share   −          −        −     (2,261,131)   −         −       (2,261,131)                                  Net cash used in investing activities                   (25,324,348)   (26,124,329)
                                                                                                                                         Cash flows from financing activities:
         Issuance of 9,745 shares of preferred stock   19,352,310   −   −     −        −           −       19,352,310                       Net increase (decrease) in deposits                                  21,951,310   (11,485,334)
                                                                                                                                            Net increase in short-term borrowings                                 6,454,369    1,031,202
         Issuance of 525,459 shares of common stock   −    26,273  10,410,284   −      −           −       10,436,557                       Proceeds from notes payable                                           6,700,000        −

         Purchase of 75,027 common shares for treasury   −   −       −        −     (1,412,143)    −       (1,412,143)                      Principal payments on notes payable                                  (1,000,000)   (1,000,000)
                                                                                                                                            Proceeds from Federal Home Loan Bank borrowings                       7,000,000   11,000,000
         Stock options exercised – 100,640 common                                                                                           Payments of Federal Home Loan Bank borrowings                       (26,741,621)   (3,380,693)
           shares from treasury                  −          −       134,391   −      1,153,116     −        1,287,507                       Stock options exercised                                               1,287,507    1,029,306
                                                                                                                                            Issuance of preferred stock                                          19,352,310        −
         Unrealized net holding losses on                                                                                                   Issuance of common stock                                             10,436,557        −
           available-for-sale securities, net of related
           tax effect                            −            −        −        −         −       (870,578)      (870,578)                  Purchase of treasury stock                                           (1,412,143)   (1,287,637)
                                                                                                                                            Dividends paid                                                        (2,261,131)    (1,743,916)
         Balance at December 31, 2018       $  19,352,310     288,983  19,499,123  87,128,813  (5,524,609)   (1,083,134)   119,661,486                  Net cash provided by (used in) financing activities      41,767,158    (5,837,072)
                                                                                                                                                        Net increase (decrease) in cash and cash equivalents     25,855,499   (17,090,396)
                                                                                                                                         Cash and cash equivalents at beginning of year                          54,455,928   71,546,324
         See accompanying notes to consolidated financial statements.                                                                                   Cash and cash equivalents at end of year               $  80,311,427   54,455,928


                                                                                                                                         See accompanying notes to consolidated financial statements.

              12                                                                    ANNUAL REPOR T 2018                                  ANNUAL REPOR T 2018                                                                          13
   9   10   11   12   13   14   15   16   17   18   19