
Page 50 - Real Estate One - Marketing Support
P. 50
Inventory
TAAR 5-County Condos
Traverse Area Association of Realtors
600 500 400 300 200 100
0
363 429
Mar 30th Jun 30th
2017 2018
400
Sep 30th 2019
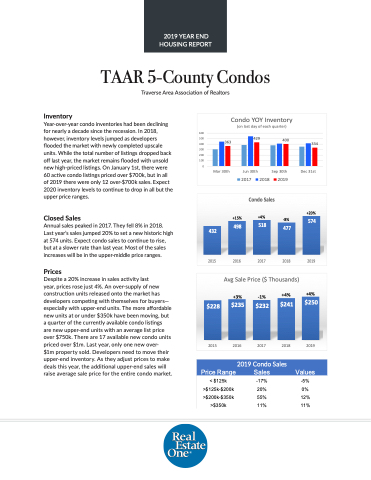
Condo YOY Inventory (on last day of each quarter)
Dec 31st
334
Year-over-year condo inventories had been declining for nearly a decade since the recession. In 2018, however, inventory levels jumped as developers flooded the market with newly completed upscale units. While the total number of listings dropped back off last year, the market remains flooded with unsold new high-priced listings. On January 1st, there were 60 active condo listings priced over $700k, but in all of 2019 there were only 12 over-$700k sales. Expect 2020 inventory levels to continue to drop in all but the upper price ranges.
Closed Sales
Annual sales peaked in 2017. They fell 8% in 2018. Last year’s sales jumped 20% to set a new historic high at 574 units. Expect condo sales to continue to rise, but at a slower rate than last year. Most of the sales increases will be in the upper-middle price ranges.
Prices
Despite a 20% increase in sales activity last
year, prices rose just 4%. An over-supply of new construction units released onto the market has developers competing with themselves for buyers— especially with upper-end units. The more affordable new units at or under $350k have been moving, but a quarter of the currently available condo listings
are new upper-end units with an average list price over $750k. There are 17 available new condo units priced over $1m. Last year, only one new over-
$1m property sold. Developers need to move their upper-end inventory. As they adjust prices to make deals this year, the additional upper-end sales will raise average sale price for the entire condo market.
432
498
+15%
Condo Sales
+4%
518
+20%
574 477
-8%
2015 2016 2017 2018 2019
$228
2015
$235 $232 $241
Avg Sale Price ($ Thousands)
+4%
$250
+3% -1% +4%
2016 2017 2018 2019
2019 Condo Sales
Price Range Sales Values
< $125k >$125k-$200k >$200k-$350k >$350k
-17% -5% 20% 0% 55% 12% 11% 11%
2019 YEAR END HOUSING REPORT
