
Page 51 - Real Estate One - Marketing Support
P. 51
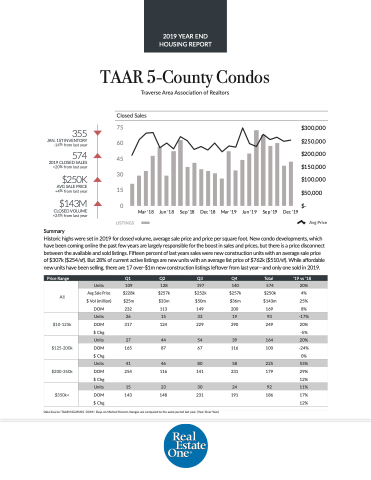
 TAAR 5-County Condos
Traverse Area Association of Realtors Closed Sales
355
JAN. 1ST INVENTORY -14% from last year
574
2019 CLOSED SALES +20% from last year
$250K
AVG SALE PRICE +4% from last year
$143M
CLOSED VOLUME +25% from last year
Summary
Avg Price
   75 60 45 30 15
0
Mar '18
Jun '18
Sep '18
Dec '18
Mar '19
Jun '19
Sep '19
Dec '19
$300,000 $250,000 $200,000 $150,000 $100,000 $50,000 $-
  LISTINGS
Historic highs were set in 2019 for closed volume, average sale price and price per square foot. New condo developments, which have been coming online the past few years are largely responsible for the boost in sales and prices, but there is a price disconnect between the available and sold listings. Fifteen percent of last years sales were new construction units with an average sale price of $307k ($254/sf). But 28% of current active listings are new units with an average list price of $762k ($510/sf). While affordable new units have been selling, there are 17 over-$1m new construction listings leftover from last year—and only one sold in 2019.
  e Price Range
   Q1
 Q2
 Q3
 Q4
 Total
 ‘19 vs ‘18
 All
Units
109
128
197
140
574
20%
Avg Sale Price
$228k
$257k
$252k
$257k
$250k
4%
$ Vol (million)
$25m
$33m
$50m
$36m
$143m
25%
DOM
 232
 113
 149
 200
 169
 8%
  $10-125k
 Units
26
15
33
19
93
-17%
DOM
317
124
229
290
249
20%
$ Chg
-5%
$125-200k
 Units
 27
 44
 54
 39
 164
 20%
DOM
165
87
67
116
100
-24% 0%
$ Chg
 $200-350k
 Units
 41
 46
 80
 58
 225
 55%
DOM $ Chg
254
116
141
231
179
29% 12%
 $350k+
  Units
 15
 23
 30
 24
 92
 11%
DOM
143
 148
 231
 191
 186
 17% 12%
 $ Chg
  Data Source: TAAR/NGLRMLS DOM= Days on Market Percent changes are compared to the same period last year. (Year-Over-Year)
2019 YEAR END HOUSING REPORT
