
Page 53 - Real Estate One - Marketing Support
P. 53
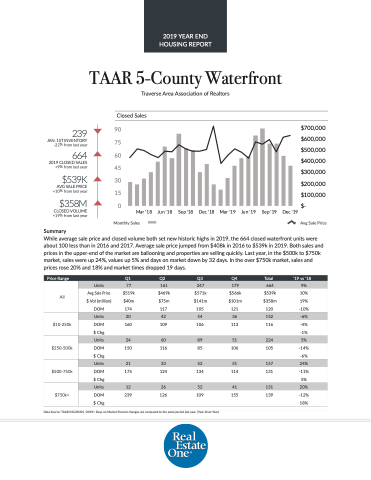
 TAAR 5-County Waterfront
Traverse Area Association of Realtors Closed Sales
239
JAN. 1ST INVENTORY -22% from last year
664
2019 CLOSED SALES +9% from last year
$539K
AVG SALE PRICE +10% from last year
$358M
CLOSED VOLUME +19% from last year
Summary
   90
75
60
45
30
15
0
Mar '18
Jun '18
Sep '18
Dec '18
Mar '19
Jun '19
Sep '19
Dec '19
$700,000 $600,000 $500,000 $400,000 $300,000 $200,000 $100,000 $-
 Monthly Sales
Avg Sale Price
While average sale price and closed volume both set new historic highs in 2019, the 664 closed waterfront units were about 100 less than in 2016 and 2017. Average sale price jumped from $408k in 2016 to $539k in 2019. Both sales and prices in the upper-end of the market are ballooning and properties are selling quickly. Last year, in the $500k to $750k market, sales were up 24%, values up 5% and days on market down by 32 days. In the over $750k market, sales and prices rose 20% and 18% and market times dropped 19 days.
  e Price Range
   Q1
 Q2
 Q3
 Q4
 Total
 ‘19 vs ‘18
 All
Units
77
161
247
179
664
9%
Avg Sale Price
$519k
$469k
$571k
$566k
$539k
10%
$ Vol (million)
$40m
$75m
$141m
$101m
$358m
19%
DOM
 174
 117
 105
 121
 120
 -10%
  $10-250k
 Units
20
42
54
36
152
-6%
DOM
160
109
106
113
116
-4%
$ Chg
-1%
$250-500k
 Units
 24
 60
 89
 51
 224
 5%
DOM
150
116
85
106
105
-14% -6%
$ Chg
 $500-750k
 Units
 21
 33
 52
 51
 157
 24%
DOM $ Chg
175
124
134
114
131
-11% 5%
 $750k+
  Units
 12
 26
 52
 41
 131
 20%
DOM
239
 126
 109
 155
 139
 -12% 18%
 $ Chg
  Data Source: TAAR/NGLRMLS DOM= Days on Market Percent changes are compared to the same period last year. (Year-Over-Year)
2019 YEAR END HOUSING REPORT
