
Page 55 - Real Estate One - Marketing Support
P. 55
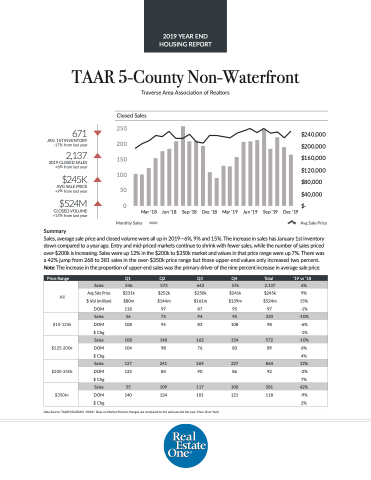
 TAAR 5-County Non-Waterfront
Traverse Area Association of Realtors Closed Sales
671
JAN. 1ST INVENTORY -17% from last year
2,137
2019 CLOSED SALES +6% from last year
$245K
AVG SALE PRICE +9% from last year
$524M
CLOSED VOLUME +15% from last year
Summary
Avg Sale Price
   250
200
150
100
50 0
Mar '18
Jun '18
Sep '18
Dec '18
Mar '19
Jun '19
Sep '19
Dec '19
$240,000 $200,000 $160,000 $120,000 $80,000 $40,000 $-
  Monthly Sales
Sales, average sale price and closed volume were all up in 2019—6%, 9% and 15%. The increase in sales has January 1st inventory down compared to a year ago. Entry and mid-priced markets continue to shrink with fewer sales, while the number of sales priced over-$200k is increasing. Sales were up 12% in the $200k to $350k market and values in that price range were up 7%. There was a 42% jump from 268 to 381 sales in the over-$350k price range but those upper-end values only increased two percent. Note: The increase in the proportion of upper-end sales was the primary driver of the nine percent increase in average sale price.
  e Price Range
   Q1
 Q2
 Q3
 Q4
 Total
 ‘19 vs ‘18
 All
Sales
346
573
642
576
2,137
6%
Avg Sale Price
$231k
$252k
$250k
$241k
$245k
9%
$ Vol (million)
$80m
$144m
$161m
$139m
$524m
15%
DOM
118
97
87
95
97
-1%
 $10-125k
  Sales
 56
 75
 94
 95
 320
 -10%
DOM
108
95
83
108
98
-6%
$ Chg
-1%
$125-200k
 Sales
 108
 148
 162
 154
 572
 -10%
DOM
104
98
76
83
89
6%
$ Chg
4%
 $200-350k
 Sales
 127
 241
 269
 227
 864
 12%
DOM
125
84
90
86
92
-2%
$ Chg
      7%
  $350k+
 Sales
55
109
117
100
381
42%
DOM
140
124
101
121
118
-9%
$ Chg
      2%
  Data Source: TAAR/NGLRMLS DOM= Days on Market Percent changes are compared to the same period last year. (Year-Over-Year)
2019 YEAR END HOUSING REPORT
