
Page 54 - Real Estate One - Marketing Support
P. 54
TAAR 5-County Non-Waterfront
Traverse Area Association of Realtors
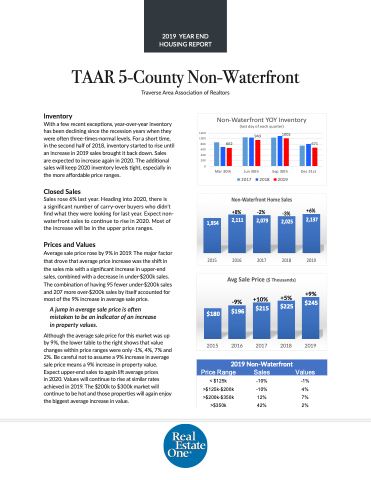
Inventory
With a few recent exceptions, year-over-year inventory has been declining since the recession years when they were often three-times-normal levels. For a short time, in the second half of 2018, inventory started to rise until an increase in 2019 sales brought it back down. Sales are expected to increase again in 2020. The additional sales will keep 2020 inventory levels tight, especially in the more affordable price ranges.
Closed Sales
Sales rose 6% last year. Heading into 2020, there is
a significant number of carry-over buyers who didn’t find what they were looking for last year. Expect non- waterfront sales to continue to rise in 2020. Most of the increase will be in the upper price ranges.
Prices and Values
Average sale price rose by 9% in 2019. The major factor that drove that average price increase was the shift in the sales mix with a significant increase in upper-end sales, combined with a decrease in under-$200k sales. The combination of having 95 fewer under-$200k sales and 207 more over-$200k sales by itself accounted for most of the 9% increase in average sale price.
A jump in average sale price is often mistaken to be an indicator of an increase in property values.
Although the average sale price for this market was up by 9%, the lower table to the right shows that value changes within price ranges were only -1%, 4%, 7% and 2%. Be careful not to assume a 9% increase in average sale price means a 9% increase in property value. Expect upper-end sales to again lift average prices
in 2020. Values will continue to rise at similar rates achieved in 2019. The $200k to $300k market will continue to be hot and those properties will again enjoy the biggest average increase in value.
1200 1000 800 600 400 200 0
943
Jun 30th 2017 2018
1002
Sep 30th 2019
Non-Waterfront YOY Inventory (last day of each quarter)
662
671
Mar 30th
Dec 31st
1,954
2015
Non-Waterfront Home Sales
+8% -2%
2,111 2,079 2,025 2,137
2016 2017 2018 2019
-3%
+6%
$180
2015
$196
Avg Sale Price ($ Thousands)
+9%
$245
-9%
$215
+10%
+5%
$225
2016 2017
2018 2019
2019 Non-Waterfront
Price Range Sales Values
< $125k >$125k-$200k >$200k-$350k >$350k
-10% -1% -10% 4% 12% 7% 42% 2%
2019 YEAR END HOUSING REPORT
