
Page 56 - Real Estate One - Marketing Support
P. 56
Antrim County Waterfront
Single Family Homes
Closed Sales
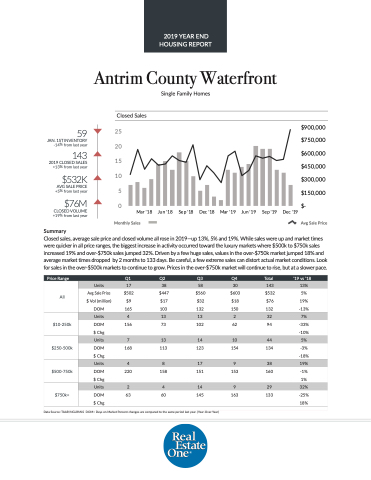
59
JAN. 1ST INVENTORY -14% from last year
143
2019 CLOSED SALES +13% from last year
$532K
AVG SALE PRICE +5% from last year
$76M
CLOSED VOLUME +19% from last year
Summary
25 20 15 10
5 0
Mar '18
Jun '18
Sep '18
Dec '18
Mar '19
Jun '19
Sep '19
Dec '19
$900,000 $750,000 $600,000 $450,000 $300,000 $150,000 $-
Monthly Sales
Avg Sale Price
Closed sales, average sale price and closed volume all rose in 2019—up 13%, 5% and 19%. While sales were up and market times were quicker in all price ranges, the biggest increase in activity occurred toward the luxury markets where $500k to $750k sales increased 19% and over-$750k sales jumped 32%. Driven by a few huge sales, values in the over-$750k market jumped 18% and averagemarkettimesdropped by2monthsto133days.Becareful,afewextremesalescandistortactualmarketconditions.Look for sales in the over-$500k markets to continue to grow. Prices in the over-$750k market will continue to rise, but at a slower pace.
e Price Range
Q1
Q2
Q3
Q4
Total
‘19 vs ‘18
All
Units
17
38
58
30
143
13%
Avg Sale Price
$502
$447
$560
$603
$532
5%
$ Vol (million)
$9
$17
$32
$18
$76
19%
DOM
165
103
132
150
132
-13%
$10-250k
Units
4
13
13
2
32
7%
DOM
156
73
102
62
94
-33%
$ Chg
-10%
$250-500k
Units
7
13
14
10
44
5%
DOM
168
113
123
154
134
-3% -18%
$ Chg
$500-750k
Units
4
8
17
9
38
19%
DOM $ Chg
220
158
151
153
160
-1% 1%
$750k+
Units
2
4
14
9
29
32%
DOM
63
60
145
163
133
-25% 18%
$ Chg
Data Source: TAAR/NGLRMLS DOM= Days on Market Percent changes are compared to the same period last year. (Year-Over-Year)
2019 YEAR END HOUSING REPORT
