
Page 58 - Real Estate One - Marketing Support
P. 58
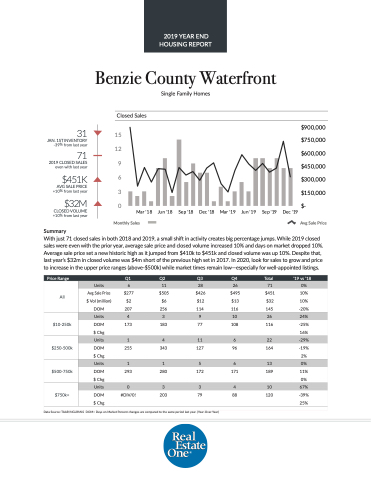
 Benzie County Waterfront
Single Family Homes
 Closed Sales
31
JAN. 1ST INVENTORY -39% from last year
71
2019 CLOSED SALES even with last year
$451K
AVG SALE PRICE +10% from last year
$32M
CLOSED VOLUME +10% from last year
Summary
  15
12
9
6
3
0
Mar '18
Jun '18
Sep '18
Dec '18
Mar '19
Jun '19
Sep '19
Dec '19
$900,000 $750,000 $600,000 $450,000 $300,000 $150,000 $-
 Monthly Sales
Avg Sale Price
With just 71 closed sales in both 2018 and 2019, a small shift in activity creates big percentage jumps. While 2019 closed sales were even with the prior year, average sale price and closed volume increased 10% and days on market dropped 10%. Average sale price set a new historic high as it jumped from $410k to $451k and closed volume was up 10%. Despite that, last year’s $32m in closed volume was $4m short of the previous high set in 2017. In 2020, look for sales to grow and price to increase in the upper price ranges (above-$500k) while market times remain low—especially for well-appointed listings.
  e Price Range
   Q1
 Q2
 Q3
 Q4
 Total
 ‘19 vs ‘18
 All
Units
6
11
28
26
71
0%
Avg Sale Price
$277
$505
$426
$495
$451
10%
$ Vol (million)
$2
$6
$12
$13
$32
10%
DOM
 207
 256
 114
 116
 145
 -20%
  $10-250k
 Units
4
3
9
10
26
24%
DOM
173
183
77
108
116
-25%
$ Chg
16%
$250-500k
 Units
 1
 4
 11
 6
 22
 -29%
DOM
255
343
127
96
164
-19% 2%
$ Chg
 $500-750k
 Units
 1
 1
 5
 6
 13
 0%
DOM $ Chg
293
280
172
171
189
11% 0%
 $750k+
  Units
 0
 3
 3
 4
 10
 67%
DOM
#DIV/0!
 203
 79
 88
 120
 -39% 25%
 $ Chg
  Data Source: TAAR/NGLRMLS DOM= Days on Market Percent changes are compared to the same period last year. (Year-Over-Year)
2019 YEAR END HOUSING REPORT
