
Page 59 - Real Estate One - Marketing Support
P. 59
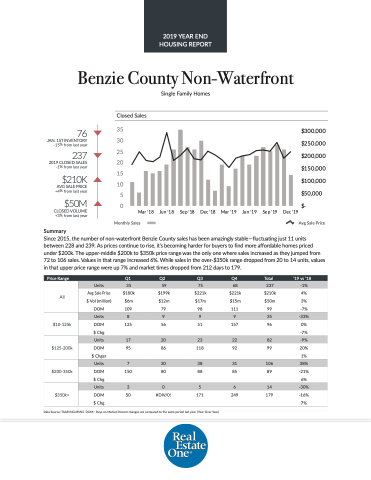
 Benzie County Non-Waterfront
Single Family Homes
 Closed Sales
76
JAN. 1ST INVENTORY -15% from last year
237
2019 CLOSED SALES -1% from last year
$210K
AVG SALE PRICE +4% from last year
$50M
CLOSED VOLUME +3% from last year
Summary
Avg Sale Price
  35
30
25
20
15
10
5 0
Mar '18
Jun '18
Sep '18
Dec '18
Mar '19
Jun '19
Sep '19
Dec '19
$300,000 $250,000 $200,000 $150,000 $100,000 $50,000 $-
  Monthly Sales
Since 2015, the number of non-waterfront Benzie County sales has been amazingly stable—fluctuating just 11 units between 228 and 239. As prices continue to rise, it’s becoming harder for buyers to find more affordable homes priced under $200k. The upper-middle $200k to $350k price range was the only one where sales increased as they jumped from 72 to 106 sales. Values in that range increased 6%. While sales in the over-$350k range dropped from 20 to 14 units, values in that upper price range were up 7% and market times dropped from 212 days to 179.
  e Price Range
   Q1
 Q2
 Q3
 Q4
 Total
 ‘19 vs ‘18
 All
Units
35
59
75
68
237
-1%
Avg Sale Price
$180k
$199k
$221k
$221k
$210k
4%
$ Vol (million)
$6m
$12m
$17m
$15m
$50m
3%
DOM
 109
 79
 98
 111
 99
 -7%
  $10-125k
 Units
8
9
9
9
35
-33%
DOM
125
56
51
157
96
0%
$ Chg
-7%
$125-200k
 Units
 17
 20
 23
 22
 82
 -9%
DOM
95
86
118
92
99
20% 1%
$ Chger
 $200-350k
 Units
 7
 30
 38
 31
 106
 38%
DOM $ Chg
150
80
88
85
89
-21% 6%
 $350k+
  Units
 3
 0
 5
 6
 14
 -30%
DOM
50
 #DIV/0!
 171
 249
 179
 -16% 7%
 $ Chg
  Data Source: TAAR/NGLRMLS DOM= Days on Market Percent changes are compared to the same period last year. (Year-Over-Year)
2019 YEAR END HOUSING REPORT
