
Page 61 - Real Estate One - Marketing Support
P. 61
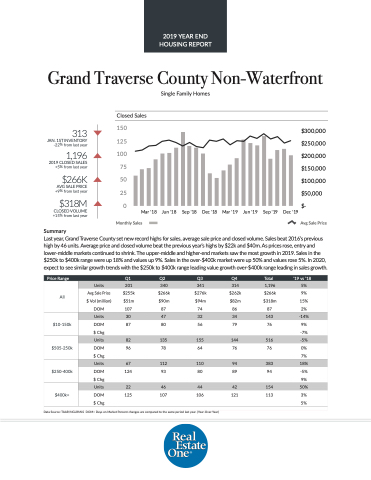
 Grand Traverse County Non-Waterfront
Single Family Homes
 Closed Sales
313
JAN. 1ST INVENTORY -22% from last year
1,196
2019 CLOSED SALES +5% from last year
$266K
AVG SALE PRICE +9% from last year
$318M
CLOSED VOLUME +15% from last year
Summary
Avg Sale Price
  150 125 100
75 50 25
0
Mar '18
Jun '18
Sep '18
Dec '18
Mar '19
Jun '19
Sep '19
Dec '19
$300,000 $250,000 $200,000 $150,000 $100,000 $50,000 $-
  Monthly Sales
Last year, Grand Traverse County set new record highs for sales, average sale price and closed volume. Sales beat 2016’s previous high by 46 units. Average price and closed volume beat the previous year’s highs by $22k and $40m. As prices rose, entry and lower-middle markets continued to shrink. The upper-middle and higher-end markets saw the most growth in 2019. Sales in the $250k to $400k range were up 18% and values up 9%. Sales in the over-$400k market were up 50% and values rose 5%. In 2020, expect to see similar growth trends with the $250k to $400k range leading value growth over-$400k range leading in sales growth.
  e Price Range
   Q1
 Q2
 Q3
 Q4
 Total
 ‘19 vs ‘18
 All
Units
201
340
341
314
1,196
5%
Avg Sale Price
$255k
$266k
$276k
$262k
$266k
9%
$ Vol (million)
$51m
$90m
$94m
$82m
$318m
15%
DOM
 107
 87
 74
 86
 87
 2%
  $10-150k
 Units
30
47
32
34
143
-14%
DOM
87
80
56
79
76
9%
$ Chg
-7%
$505-250k
 Units
 82
 135
 155
 144
 516
 -5%
DOM
96
78
64
76
76
0% 7%
$ Chg
 $250-400k
 Units
 67
 112
 110
 94
 383
 18%
DOM $ Chg
124
93
80
89
94
-5% 9%
 $400k+
  Units
 22
 46
 44
 42
 154
 50%
DOM
125
 107
 106
 121
 113
 3% 5%
 $ Chg
  Data Source: TAAR/NGLRMLS DOM= Days on Market Percent changes are compared to the same period last year. (Year-Over-Year)
2019 YEAR END HOUSING REPORT
