
Page 62 - Real Estate One - Marketing Support
P. 62
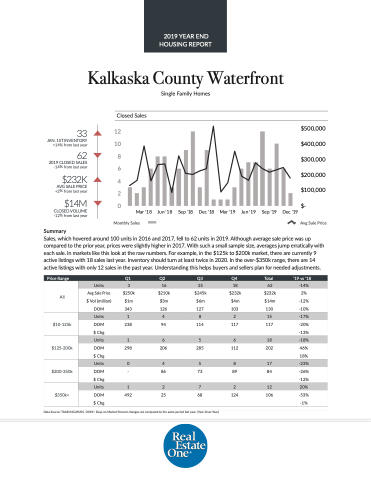
 Kalkaska County Waterfront
Single Family Homes
 Closed Sales
33
JAN. 1ST INVENTORY +14% from last year
62
2019 CLOSED SALES -14% from last year
$232K
AVG SALE PRICE +2% from last year
$14M
CLOSED VOLUME -12% from last year
Summary
  12
10
8
6
4
2
0
Mar '18
Jun '18
Sep '18
Dec '18
Mar '19
Jun '19
Sep '19
Dec '19
$500,000 $400,000 $300,000 $200,000 $100,000 $-
 Monthly Sales
Avg Sale Price
Sales, which hovered around 100 units in 2016 and 2017, fell to 62 units in 2019. Although average sale price was up compared to the prior year, prices were slightly higher in 2017. With such a small sample size, averages jump erratically with each sale. In markets like this look at the raw numbers. For example, in the $125k to $200k market, there are currently 9 active listings with 18 sales last year. Inventory should turn at least twice in 2020. In the over-$350k range, there are 14 active listings with only 12 sales in the past year. Understanding this helps buyers and sellers plan for needed adjustments.
  e Price Range
   Q1
 Q2
 Q3
 Q4
 Total
 ‘19 vs ‘18
 All
Units
3
16
25
18
62
-14%
Avg Sale Price
$250k
$210k
$245k
$232k
$232k
2%
$ Vol (million)
$1m
$3m
$6m
$4m
$14m
-12%
DOM
 343
 126
 127
 103
 130
 -10%
  $10-125k
 Units
1
4
8
2
15
-17%
DOM
238
94
114
117
117
-20%
$ Chg
-13%
$125-200k
 Units
 1
 6
 5
 6
 18
 -18%
DOM
298
206
285
112
202
46% 18%
$ Chg
 $200-350k
 Units
 0
 4
 5
 8
 17
 -23%
DOM $ Chg
-
86
73
89
84
-26% -12%
 $350k+
  Units
 1
 2
 7
 2
 12
 20%
DOM
492
 25
 68
 124
 106
 -53% -1%
 $ Chg
  Data Source: TAAR/NGLRMLS DOM= Days on Market Percent changes are compared to the same period last year. (Year-Over-Year)
2019 YEAR END HOUSING REPORT
