
Page 63 - Real Estate One - Marketing Support
P. 63
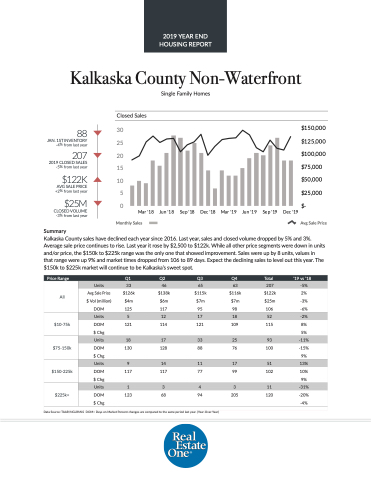
 Kalkaska County Non-Waterfront
Single Family Homes
 Closed Sales
88
JAN. 1ST INVENTORY -4% from last year
207
2019 CLOSED SALES -5% from last year
$122K
AVG SALE PRICE +2% from last year
$25M
CLOSED VOLUME -3% from last year
Summary
Avg Sale Price
  30 25 20 15 10
5 0
Mar '18
Jun '18
Sep '18
Dec '18
Mar '19
Jun '19
Sep '19
Dec '19
$150,000 $125,000 $100,000 $75,000 $50,000 $25,000 $-
  Monthly Sales
Kalkaska County sales have declined each year since 2016. Last year, sales and closed volume dropped by 5% and 3%. Average sale price continues to rise. Last year it rose by $2,500 to $122k. While all other price segments were down in units and/or price, the $150k to $225k range was the only one that showed improvement. Sales were up by 8 units, values in that range were up 9% and market times dropped from 106 to 89 days. Expect the declining sales to level out this year. The $150k to $225k market will continue to be Kalkaska’s sweet spot.
  e Price Range
   Q1
 Q2
 Q3
 Q4
 Total
 ‘19 vs ‘18
 All
Units
33
46
65
63
207
-5%
Avg Sale Price
$126k
$138k
$115k
$116k
$122k
2%
$ Vol (million)
$4m
$6m
$7m
$7m
$25m
-3%
DOM
 125
 117
 95
 98
 106
 -6%
  $10-75k
 Units
5
12
17
18
52
-2%
DOM
121
114
121
109
115
8%
$ Chg
5%
$75-150k
 Units
 18
 17
 33
 25
 93
 -11%
DOM
130
128
88
76
100
-15% 9%
$ Chg
 $150-225k
 Units
 9
 14
 11
 17
 51
 13%
DOM $ Chg
117
117
77
99
102
10% 9%
 $225k+
  Units
 1
 3
 4
 3
 11
 -31%
DOM
123
 68
 94
 205
 120
 -20% -4%
 $ Chg
  Data Source: TAAR/NGLRMLS DOM= Days on Market Percent changes are compared to the same period last year. (Year-Over-Year)
2019 YEAR END HOUSING REPORT
