
Page 65 - Real Estate One - Marketing Support
P. 65
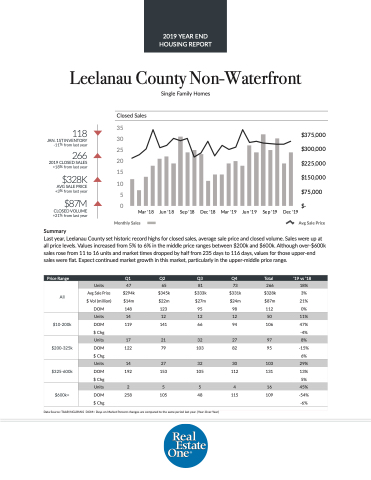
 Leelanau County Non-Waterfront
Single Family Homes
 Closed Sales
118
JAN. 1ST INVENTORY -11% from last year
266
2019 CLOSED SALES +18% from last year
$328K
AVG SALE PRICE +3% from last year
$87M
CLOSED VOLUME +21% from last year
Summary
Avg Sale Price
  35
30
25
20
15
10
5 0
Mar '18
Jun '18
Sep '18
Dec '18
Mar '19
Jun '19
Sep '19
Dec '19
$375,000 $300,000 $225,000 $150,000 $75,000 $-
  Monthly Sales
Last year, Leelanau County set historic record highs for closed sales, average sale price and closed volume. Sales were up at all price levels. Values increased from 5% to 6% in the middle price ranges between $200k and $600k. Although over-$600k sales rose from 11 to 16 units and market times dropped by half from 235 days to 116 days, values for those upper-end sales were flat. Expect continued market growth in this market, particularly in the upper-middle price range.
  e Price Range
   Q1
 Q2
 Q3
 Q4
 Total
 ‘19 vs ‘18
 All
Units
47
65
81
73
266
18%
Avg Sale Price
$294k
$345k
$333k
$331k
$328k
3%
$ Vol (million)
$14m
$22m
$27m
$24m
$87m
21%
DOM
 148
 123
 95
 98
 112
 0%
  $10-200k
 Units
14
12
12
12
50
11%
DOM
119
141
66
94
106
47%
$ Chg
-4%
$200-325k
 Units
 17
 21
 32
 27
 97
 8%
DOM
122
79
103
82
95
-15% 6%
$ Chg
 $325-600k
 Units
 14
 27
 32
 30
 103
 29%
DOM $ Chg
192
153
105
112
131
13% 5%
 $600k+
  Units
 2
 5
 5
 4
 16
 45%
DOM
258
 105
 48
 115
 109
 -54% -6%
 $ Chg
  Data Source: TAAR/NGLRMLS DOM= Days on Market Percent changes are compared to the same period last year. (Year-Over-Year)
2019 YEAR END HOUSING REPORT
