
Page 67 - Real Estate One - Marketing Support
P. 67
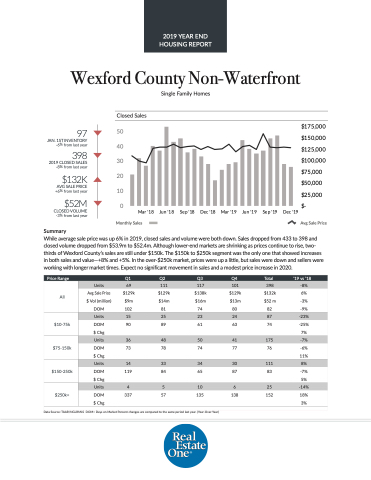
 Wexford County Non-Waterfront
Single Family Homes
 Closed Sales
97
JAN. 1ST INVENTORY -6% from last year
398
2019 CLOSED SALES -8% from last year
$132K
AVG SALE PRICE +6% from last year
$52M
CLOSED VOLUME -3% from last year
Summary
Avg Sale Price
  50 40 30 20 10
0
Mar '18
Jun '18
Sep '18
Dec '18
Mar '19
Jun '19
Sep '19
Dec '19
$175,000 $150,000 $125,000 $100,000 $75,000 $50,000 $25,000 $-
  Monthly Sales
While average sale price was up 6% in 2019, closed sales and volume were both down. Sales dropped from 433 to 398 and closed volume dropped from $53.9m to $52.4m. Although lower-end markets are shrinking as prices continue to rise, two- thirds of Wexford County’s sales are still under $150k. The $150k to $250k segment was the only one that showed increases in both sales and value—+8% and +5%. In the over-$250k market, prices were up a little, but sales were down and sellers were working with longer market times. Expect no significant movement in sales and a modest price increase in 2020.
  e Price Range
   Q1
 Q2
 Q3
 Q4
 Total
 ‘19 vs ‘18
 All
Units
69
111
117
101
398
-8%
Avg Sale Price
$129k
$129k
$138k
$129k
$132k
6%
$ Vol (million)
$9m
$14m
$16m
$13m
$52 m
-3%
DOM
 102
 81
 74
 80
 82
 -9%
  $10-75k
 Units
15
25
23
24
87
-23%
DOM
90
89
61
63
74
-25%
$ Chg
7%
$75-150k
 Units
 36
 48
 50
 41
 175
 -7%
DOM
73
78
74
77
76
-6% 11%
$ Chg
 $150-250k
 Units
 14
 33
 34
 30
 111
 8%
DOM $ Chg
119
84
65
87
83
-7% 5%
 $250k+
  Units
 4
 5
 10
 6
 25
 -14%
DOM
337
 57
 135
 138
 152
 18% 3%
 $ Chg
  Data Source: TAAR/NGLRMLS DOM= Days on Market Percent changes are compared to the same period last year. (Year-Over-Year)
2019 YEAR END HOUSING REPORT
