
Page 66 - Real Estate One - Marketing Support
P. 66
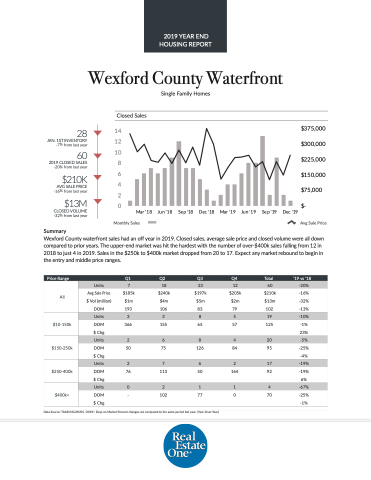
 Wexford County Waterfront
Single Family Homes
 Closed Sales
28
JAN. 1ST INVENTORY -7% from last year
60
2019 CLOSED SALES -20% from last year
$210K
AVG SALE PRICE -16% from last year
$13M
CLOSED VOLUME -32% from last year
Summary
  14 12 10
8
6
4
2
0
Mar '18
Jun '18
Sep '18
Dec '18
Mar '19
Jun '19
Sep '19
Dec '19
$375,000 $300,000 $225,000 $150,000 $75,000 $-
 Monthly Sales
Avg Sale Price
Wexford County waterfront sales had an off year in 2019. Closed sales, average sale price and closed volume were all down compared to prior years. The upper-end market was hit the hardest with the number of over-$400k sales falling from 12 in 2018 to just 4 in 2019. Sales in the $250k to $400k market dropped from 20 to 17. Expect any market rebound to begin in the entry and middle price ranges.
  e Price Range
   Q1
 Q2
 Q3
 Q4
 Total
 ‘19 vs ‘18
 All
Units
7
18
23
12
60
-20%
Avg Sale Price
$185k
$240k
$197k
$205k
$210k
-16%
$ Vol (million)
$1m
$4m
$5m
$2m
$13m
-32%
DOM
 193
 106
 83
 79
 102
 -13%
  $10-150k
 Units
3
3
8
5
19
-10%
DOM
366
155
65
57
125
-1%
$ Chg
23%
$150-250k
 Units
 2
 6
 8
 4
 20
 -5%
DOM
50
75
126
84
95
-25% -4%
$ Chg
 $250-400k
 Units
 2
 7
 6
 2
 17
 -19%
DOM $ Chg
76
113
50
164
92
-19% 6%
 $400k+
  Units
 0
 2
 1
 1
 4
 -67%
DOM
-
 102
 77
 0
 70
 -25% -1%
 $ Chg
  Data Source: TAAR/NGLRMLS DOM= Days on Market Percent changes are compared to the same period last year. (Year-Over-Year)
2019 YEAR END HOUSING REPORT
