
Page 64 - Real Estate One - Marketing Support
P. 64
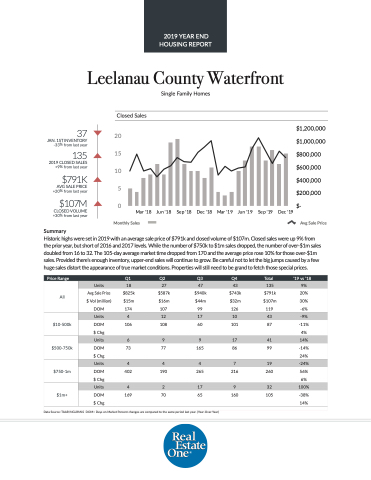
 Leelanau County Waterfront
Single Family Homes
 Closed Sales
37
JAN. 1ST INVENTORY -33% from last year
135
2019 CLOSED SALES +9% from last year
$791K
AVG SALE PRICE +20% from last year
$107M
CLOSED VOLUME +30% from last year
Summary
  20 15 10
5 0
Mar '18
Jun '18
Sep '18
Dec '18
Mar '19
Jun '19
Sep '19
Dec '19
$1,200,000 $1,000,000 $800,000 $600,000 $400,000 $200,000 $-
 Monthly Sales
Avg Sale Price
Historic highs were set in 2019 with an average sale price of $791k and closed volume of $107m. Closed sales were up 9% from the prior year, but short of 2016 and 2017 levels. While the number of $750k to $1m sales dropped, the number of over-$1m sales doubled from 16 to 32. The 105-day average market time dropped from 170 and the average price rose 10% for those over-$1m sales. Provided there’s enough inventory, upper-end sales will continue to grow. Be careful not to let the big jumps caused by a few huge sales distort the appearance of true market conditions. Properties will still need to be grand to fetch those special prices.
  e Price Range
   Q1
 Q2
 Q3
 Q4
 Total
 ‘19 vs ‘18
 All
Units
18
27
47
43
135
9%
Avg Sale Price
$825k
$587k
$940k
$743k
$791k
20%
$ Vol (million)
$15m
$16m
$44m
$32m
$107m
30%
DOM
 174
 107
 99
 126
 119
 -6%
  $10-500k
 Units
4
12
17
10
43
-9%
DOM
106
108
60
101
87
-11%
$ Chg
4%
$500-750k
 Units
 6
 9
 9
 17
 41
 14%
DOM
73
77
165
86
99
-14% 24%
$ Chg
 $750-1m
 Units
 4
 4
 4
 7
 19
 -24%
DOM $ Chg
402
190
265
216
260
56% 6%
 $1m+
  Units
 4
 2
 17
 9
 32
 100%
DOM
169
 70
 65
 160
 105
 -38% 14%
 $ Chg
  Data Source: TAAR/NGLRMLS DOM= Days on Market Percent changes are compared to the same period last year. (Year-Over-Year)
2019 YEAR END HOUSING REPORT
