
Page 60 - Real Estate One - Marketing Support
P. 60
Grand Traverse County Waterfront
Single Family Homes
Closed Sales
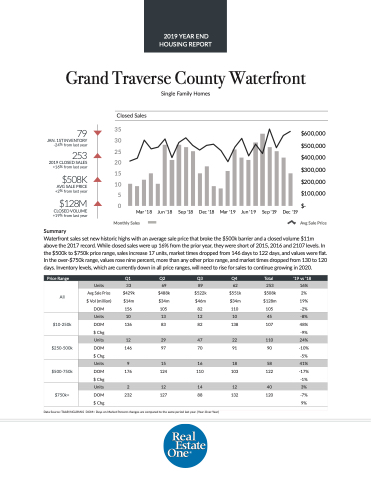
79
JAN. 1ST INVENTORY -24% from last year
253
2019 CLOSED SALES +16% from last year
$508K
AVG SALE PRICE +2% from last year
$128M
CLOSED VOLUME +19% from last year
Summary
35
30
25
20
15
10
5 0
Mar '18
Jun '18
Sep '18
Dec '18
Mar '19
Jun '19
Sep '19
Dec '19
$600,000 $500,000 $400,000 $300,000 $200,000 $100,000 $-
Monthly Sales
Avg Sale Price
Waterfront sales set new historic highs with an average sale price that broke the $500k barrier and a closed volume $11m above the 2017 record. While closed sales were up 16% from the prior year, they were short of 2015, 2016 and 2107 levels. In the $500k to $750k price range, sales increase 17 units, market times dropped from 146 days to 122 days, and values were flat. In the over-$750k range, values rose nine percent, more than any other price range, and market times dropped from 130 to 120 days. Inventory levels, which are currently down in all price ranges, will need to rise for sales to continue growing in 2020.
e Price Range
Q1
Q2
Q3
Q4
Total
‘19 vs ‘18
All
Units
33
69
89
62
253
16%
Avg Sale Price
$429k
$488k
$522k
$551k
$508k
2%
$ Vol (million)
$14m
$34m
$46m
$34m
$128m
19%
DOM
156
105
82
110
105
-2%
$10-250k
Units
10
13
12
10
45
-8%
DOM
136
83
82
138
107
48%
$ Chg
-9%
$250-500k
Units
12
29
47
22
110
24%
DOM
146
97
70
91
90
-10% -5%
$ Chg
$500-750k
Units
9
15
16
18
58
41%
DOM $ Chg
176
124
110
103
122
-17% -1%
$750k+
Units
2
12
14
12
40
3%
DOM
232
127
88
132
120
-7% 9%
$ Chg
Data Source: TAAR/NGLRMLS DOM= Days on Market Percent changes are compared to the same period last year. (Year-Over-Year)
2019 YEAR END HOUSING REPORT
