
Page 57 - Real Estate One - Marketing Support
P. 57
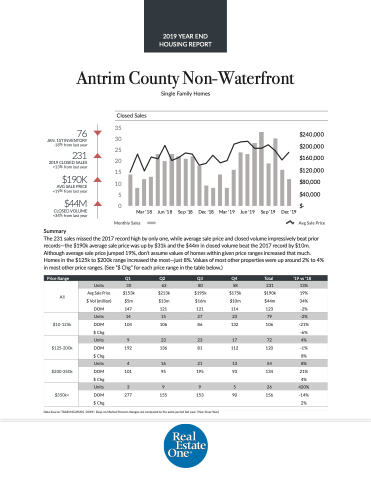
 Antrim County Non-Waterfront
Single Family Homes
 Closed Sales
76
JAN. 1ST INVENTORY -18% from last year
231
2019 CLOSED SALES +13% from last year
$190K
AVG SALE PRICE +19% from last year
$44M
CLOSED VOLUME =34% from last year
Summary
Avg Sale Price
 35
30
25
20
15
10
5 0
Mar '18
Jun '18
Sep '18
Dec '18
Mar '19
Jun '19
Sep '19
Dec '19
$240,000 $200,000 $160,000 $120,000 $80,000 $40,000 $-
   Monthly Sales
The 231 sales missed the 2017 record high by only one, while average sale price and closed volume impressively beat prior records—the $190k average sale price was up by $31k and the $44m in closed volume beat the 2017 record by $10m. Although average sale price jumped 19%, don’t assume values of homes within given price ranges increased that much. Homes in the $125k to $200k range increased the most—just 8%. Values of most other properties were up around 2% to 4% in most other price ranges. (See “$ Chg” for each price range in the table below.)
  e Price Range
   Q1
 Q2
 Q3
 Q4
 Total
 ‘19 vs ‘18
 All
Units
30
63
80
58
231
13%
Avg Sale Price
$153k
$213k
$195k
$175k
$190k
19%
$ Vol (million)
$5m
$13m
$16m
$10m
$44m
34%
DOM
 147
 121
 121
 114
 123
 -2%
  $10-125k
 Units
14
15
27
23
79
-2%
DOM
104
106
86
132
106
-21%
$ Chg
-6%
$125-200k
 Units
 9
 23
 23
 17
 72
 4%
DOM
192
136
81
112
120
-1% 8%
$ Chg
 $200-350k
 Units
 4
 16
 21
 13
 54
 8%
DOM $ Chg
101
95
195
93
134
21% 4%
 $350k+
  Units
 3
 9
 9
 5
 26
 420%
DOM
277
 155
 153
 90
 156
 -14% 2%
 $ Chg
  Data Source: TAAR/NGLRMLS DOM= Days on Market Percent changes are compared to the same period last year. (Year-Over-Year)
2019 YEAR END HOUSING REPORT
