
Page 52 - Real Estate One - Marketing Support
P. 52
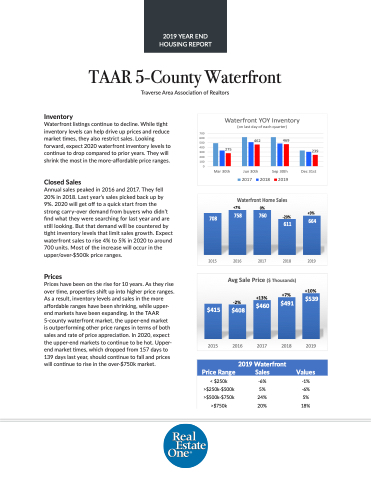
 Inventory
TAAR 5-County Waterfront
Traverse Area Association of Realtors
  700 600 500 400 300 200 100
0
469
Sep 30th 2019
239
Dec 31st
Waterfront YOY Inventory (on last day of each quarter)
    275
462
   Mar 30th
Jun 30th
2017 2018
Waterfront listings continue to decline. While tight inventory levels can help drive up prices and reduce market times, they also restrict sales. Looking forward, expect 2020 waterfront inventory levels to continue to drop compared to prior years. They will shrink the most in the more-affordable price ranges.
Closed Sales
Annual sales peaked in 2016 and 2017. They fell 20% in 2018. Last year’s sales picked back up by 9%. 2020 will get off to a quick start from the strong carry-over demand from buyers who didn’t find what they were searching for last year and are still looking. But that demand will be countered by tight inventory levels that limit sales growth. Expect waterfront sales to rise 4% to 5% in 2020 to around 700 units. Most of the increase will occur in the upper/over-$500k price ranges.
Prices
Prices have been on the rise for 10 years. As they rise over time, properties shift up into higher price ranges. As a result, inventory levels and sales in the more affordable ranges have been shrinking, while upper- end markets have been expanding. In the TAAR 5-county waterfront market, the upper-end market
is outperforming other price ranges in terms of both sales and rate of price appreciation. In 2020, expect the upper-end markets to continue to be hot. Upper- end market times, which dropped from 157 days to 139 days last year, should continue to fall and prices will continue to rise in the over-$750k market.
  708
-20%
Waterfront Home Sales
+7% 0%
+9%
664
2015 2016 2017 2018 2019
758 760
611
      -2%
$415 $408
$491
Avg Sale Price ($ Thousands)
+10%
$539 $460
+13%
+7%
     2015 2016 2017
2018 2019
2019 Waterfront
Price Range Sales Values
   < $250k >$250k-$500k >$500k-$750k >$750k
-6% -1% 5% -6% 24% 5% 20% 18%
 2019 YEAR END HOUSING REPORT
