
Page 7 - ASSET MANAGER 9 (EN)
P. 7
ASSET MANAGER • NO. 9/2018
IFZ • 7
S ch weiz 100%
Liechtenstein 71%
Fran k reich 63%
Griech en lan d 54%
Israel 54%
Hong-Kong 54%
Rumänien 50%
Russland 50%
V. Arabische Emirate 50%
Südafrika 50%
Singapur 50%
Türkei 46%
Brasilien 42%
Chile 42%
Kolumbien 42%
Bu lg arien 38%
Est lan d 38%
Lit au en 38%
Paraguay 38%
Irlan d 63%
Polen 54%
Vereinigtes Königreich 71%
Deutschland 88%
Katar 38%
Serbien 33%
Andorra 33%
Islan d 33%
Costa Rica 33%
Ecu ad or 33%
Peru 33%
Venezuela 33%
Mexiko 46%
Schweden 63%
Ungarn 54%
Belg ien 67%
Lib an on 38%
K u wait 33%
San Marino 29%
Kanada 29%
Guatemal a 29%
Bolivien 29%
Bah rain 29%
Marokko 29%
China 29%
Österreich 79%
Argentinien 46%
M on aco 63%
Zyp ern 54%
Saudi- Arab ien 38%
Oman 33%
Indonesi en 29%
Alb an ie n 25%
Puerto Rico 25%
Jord an ien 25%
Alg erien 25%
Indien 25%
Philippine n
25%
Portugal (inkl. M ad eira) 67%
Kroatien 42%
Armenien 25%
Barbado s 25%
Monten egro 21%
Belaru s 21%
M old au 21%
Domini kanisc he...
Nicarag ua 21%
Luxemburg 75%
Norweg en 54%
Th ailan d 38%
Ägypten 33%
Taiwan 29%
Finnland 58%
Lettland 42%
Aserb aid sch an 25%
Bermuda 25%
Tu n esie n 21%
Isle of Man 21%
Jersey 21%
Marshal l Islan ...
Verei nigte St...
Spanien 67%
Neu seelan d 38%
Malaysia 33%
Australie n 29%
Italien 71%
Malta 58%
Panama 54%
Vatikan 25%
Kaiman i nseln (Caym...
Sri Lanka 21%
Irak 17%
Gren ad a...
Guadel oup...
Jap an 17%
S lowak ei 42%
Britische Jungfernins eln (BVI) 38%
Bosn ien und Herzeg...
Bah amas 29%
Jemen 17%
Saint Kit...
Ku...
Ka...
El
S alvad or 25%
Mauritiu s 25%
Südkor ea 21%
Nied erlan d e 71%
Dän emark 63%
Tsch ech isch e Republik 58%
Uruguay 54%
Lib yen 17%
Saint Vinc...
C...
S...
K...
Ukraine 42%
S lowen ien 33%
Georg ien 29%
Guernse y
29%
Hondura s
25%
Mazedon ien ...
Gib ralt ar 21%
Ma...
S...
I
Vietnam 17%
Seychell en...
Sa...
E...
P...
Figure 1 – Coverage rate countries 2018
Performances and services of the supplier industry
51 companies also presented their offers to external as- set managers using a structured supplier questionnaire. In addition to company data, the main and ancillary services and their advantages are explained. In some cases, the pricing models are also available for inspection. The supply industry is still young. The median founding year is 2009 (2017: 2008) and the median number of employees is 16 (2017: 20).
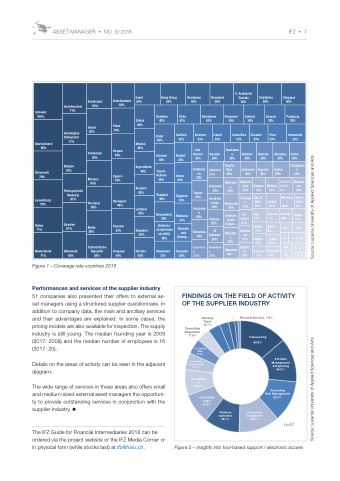
Details on the areas of activity can be seen in the adjacent diagram:
The wide range of services in these areas also offers small and medium-sized external asset managers the opportuni- ty to provide outstanding services in conjunction with the supplier industry.
The IFZ Guide for Financial Intermediaries 2018 can be ordered via the project website or the IFZ Media Corner or in physical form (while stocks last) at ifz@hslu.ch.
Figure 2 – Insights into tool-based support / electronic access
FINDINGS ON THE FIELD OF ACTIVITY OF THE SUPPLIER INDUSTRY
Advisory Personal Services, 7.8%
Taxes
15.7% Consulting
Akquisition 17.6%
Consulting M&A 19.6%
Consulting Capital market 21.6%
Consulting IT 33.3%
Consulting Legal 39.2%
Outsourcing 60.8 %
Platform operaters 45.1%
Consulting Compliance 52.9%
Portfolio Management & Reporting 56.9%
Consulting Risk Management 52.9%
n=51
Source: Lucerne University of Applied Sciences and Arts Source: Lucerne University of Applied Sciences and Arts
