
Page 208 - eProceeding - IRSTC & RESPEX 2017
P. 208
Shaifatulna’im Shamsuddin / JOJAPS – JOURNAL ONLINE JARINGAN COT POLIPD
Table 1 – Details of Data Station.
SURFACE
LOCATION FRICTION
STATION LATITUDE LONGITUDE HEIGHT ABOVE GROUND ROUGHNESS
DETAILS COEFFICIENT,ɑ
LENGTH z o
Jan1998 – Mac 2005 : 12.2m
1. Kuching 1° 29' N 110° 20' E City 0.40 0.4000
Apr 2005 – Dec 2013 : 10m
Jan1998 – Mac 2005 : 12.5m Mowed grass
2. Bintulu 3° 07' N 113° 1' E 0.20 0.0024
Apr 2005 – Dec 2013 : 10m airport field
Jan1998 – Mac 2005 : 12m
3. Miri 4° 20' N 113° 59' E City 0.40 0.4000
Apr 2005 – Dec 2013 : 10m
Kota Jan1998 – Mac 2005 : 12m
4. 5° 56' N 116° 03' E Airport 0.10 0.0024
Kinabalu Apr 2005 – Dec 2013 : 10m
Jan1998 – Mac 2005 : 14.1m
5. Labuan 5° 18' N 115° 15' E Airport 0.10 0.0024
Apr 2005 – Dec 2013 : 10m
Jan1998 – Mac 2005 : 12.2m
6 Kudat 6° 55' N 116° 50' E Airport 0.10 0.0024
Apr 2005 – Dec 2013 : 10m
Jan1998 – Mac 2005 : 12.2m
7. Sandakan 5° 54' N 118° 04' E Airport 0.10 0.0024
Apr 2005 – Dec 2013 : 10m
Mowed grass
8. Limbang 4° 48' N 115° 00' E Jan2007 – Dec2013 : 10m 0.15 0.0024
airport field
9. Kapit 2° 00' N 112° 55' E Jan2008 – Dec2013 : 10m Bushy field 0.20 0.0550
Wind Speed Data are calculated for their mean monthly and yearly value based on 3 extrapolated height, 10 meter (for
certain period only), 20 meter and 30 meter. Using the appropriate Friction Coefficient and Surface Roughness Length, both
monthly and yearly data shall then be calculated thus concluded into a table of mean data for monthly and yearly.
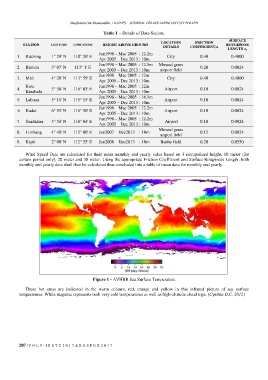
Figure 1 - AVHRR Sea Surface Temperature
These hot areas are indicated in the warm colours, red, orange and yellow in this infrared picture of sea surface
temperatures. While magenta represents both very cold temperatures as well as high-altitude cloud tops. (Cynthia O.C, 2012)
207 | V O L 9 - I R S T C 2 0 1 7 & R E S P E X 2 0 1 7