
Page 7 - SPRING SUMMER 2020 FINAL 5.12.20_Neat
P. 7
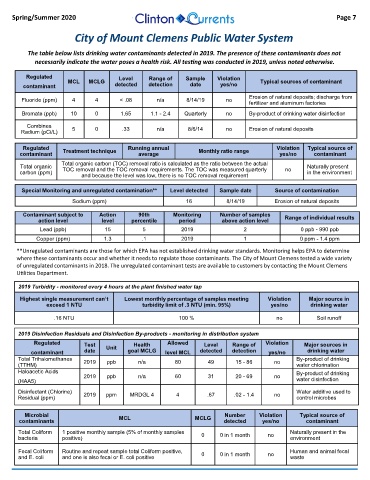
Spring/Summer 2020                                                                                                  Page 7


                          City of Mount Clemens Public Water System

          The table below lists drinking water contaminants detected in 2019. The presence of these contaminants does not
             necessarily indicate the water poses a health risk. All testing was conducted in 2019, unless noted otherwise.

          Regulated                     Level     Range of    Sample     Violation
                       MCL    MCLG                                                     Typical sources of contaminant
         contaminant                   detected   detection     date      yes/no
                                                                                   Erosion of natural deposits; discharge from
        Fluoride (ppm)   4       4       < .08       n/a       8/14/19      no
                                                                                   fertilizer and aluminum factories
        Bromate (ppb)   10       0       1.65      1.1 - 2.4   Quarterly    no     By-product of drinking water disinfection
          Combines
        Radium (pCi/L)   5       0       .33         n/a       8/6/14       no     Erosion of natural deposits

         Regulated                         Running annual                                    Violation   Typical source of
        contaminant   Treatment technique      average             Monthly ratio range        yes/no     contaminant
                     Total organic carbon (TOC) removal ratio is calculated as the ratio between the actual
        Total organic                                                                                  Naturally present
        carbon (ppm)   TOC removal and the TOC removal requirements. The TOC was measured quarterly   no   in the environment
                            and because the level was low, there is no TOC removal requirement

        Special Monitoring and unregulated contamination**   Level detected   Sample date   Source of contamination
                         Sodium (ppm)                          16           8/14/19         Erosion of natural deposits

         Contaminant subject to   Action       90th       Monitoring      Number of samples
              action level         level    percentile      period        above action level   Range of individual results
              Lead (ppb)            15          5            2019                 2                  0 ppb - 990 ppb
             Copper (ppm)          1.3          .1           2019                 1                 0 ppm - 1.4 ppm
       **Unregulated contaminants are those for which EPA has not established drinking water standards. Monitoring helps EPA to determine
       where these contaminants occur and whether it needs to regulate those contaminants. The City of Mount Clemens tested a wide variety
       of unregulated contaminants in 2018. The unregulated contaminant tests are available to customers by contacting the Mount Clemens
       Utilities Department.

       2019 Turbidity - monitored every 4 hours at the plant finished water tap
        Highest single measurement can’t   Lowest monthly percentage of samples meeting   Violation    Major source in
                exceed 1 NTU                    turbidity limit of .3 NTU (min. 95%)       yes/no       drinking water

                   .16 NTU                                  100 %                           no            Soil runoff

       2019 Disinfection Residuals and Disinfection By-products - monitoring in distribution system
            Regulated        Test            Health     Allowed      Level    Range of   Violation    Major sources in
           contaminant       date   Unit   goal MCLG    level MCL   detected   detection   yes/no      drinking water
       Total Trihalomethanes                                                                       By-product of drinking
       (TTHM)                2019   ppb        n/a         80         49       15 - 86      no     water chlorination
       Haloacetic Acids                                                                            By-product of drinking
                             2019   ppb        n/a         60         31       20 - 69      no
       (HAA5)                                                                                      water disinfection
       Disinfectant (Chlorine)                                                                     Water additive used to
       Residual (ppm)        2019   ppm     MRDGL 4        4          .67     .02 - 1.4     no     control microbes

         Microbial                                                         Number      Violation    Typical source of
       contaminants                     MCL                       MCLG     detected     yes/no        contaminant
       Total Coliform   1 positive monthly sample (5% of monthly samples   0   0 in 1 month   no   Naturally present in the
       bacteria       positive)                                                                  environment
       Fecal Coliform   Routine and repeat sample total Coliform positive,   0   0 in 1 month   no   Human and animal fecal
       and E. coli    and one is also fecal or E. coli positive                                  waste