
Page 40 - SAPEM-Chapter-10-2nd-edition-2014
P. 40
South African Pavement Engineering Manual
Chapter 10: Pavement Design
The permissible load for single wheels on axles other than steering axles, is less
than for dual-wheels for single and tandem axles. The use of wide-based super
single tyres is limited in South Africa. No limits are included in the legislation for Tyre Pressures
tyre pressures. As a result, tyre pressures are dictated by tyre specifications and
vehicle fleet operators. The Road Traffic Act does
not provide limits for tyre
In enforcing the legislation, a 5% grace is allowed on top of the permissible loads pressures. As a result,
before prosecution. Poor enforcement of the legislation often results in actual axle tyre pressures are dictated
loads significantly exceeding the legal limits. Although the permissible loads and by tyre specifications and
the level of enforcement are two important factors that determine the distribution the vehicle fleet operators.
of actual axle loads on roads, these two factors are not directly included in design
traffic calculations. Their influence is therefore indirectly accounted for through the distribution of actual axle loads.
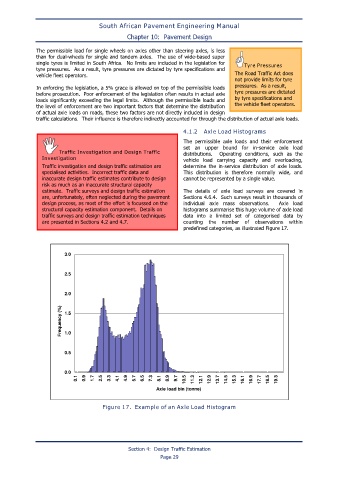
4.1.2 Axle Load Histograms
The permissible axle loads and their enforcement
set an upper bound for in-service axle load
Traffic Investigation and Design Traffic distributions. Operating conditions, such as the
Investigation vehicle load carrying capacity and overloading,
Traffic investigation and design traffic estimation are determine the in-service distribution of axle loads.
specialised activities. Incorrect traffic data and This distribution is therefore normally wide, and
inaccurate design traffic estimates contribute to design cannot be represented by a single value.
risk as much as an inaccurate structural capacity
estimate. Traffic surveys and design traffic estimation The details of axle load surveys are covered in
are, unfortunately, often neglected during the pavement Sections 4.6.4. Such surveys result in thousands of
design process, as most of the effort is focussed on the individual axle mass observations. Axle load
structural capacity estimation component. Details on histograms summarise this huge volume of axle load
traffic surveys and design traffic estimation techniques data into a limited set of categorised data by
are presented in Sections 4.2 and 4.7. counting the number of observations within
predefined categories, as illustrated Figure 17.
3.0
2.5
2.0
Frequency (%) 1.5
1.0
0.5
0.0
0.1 0.9 1.7 2.5 3.3 4.1 4.9 5.7 6.5 7.3 8.1 8.9 9.7 10.5 11.3 12.1 12.9 13.7 14.5 15.3 16.1 16.9 17.7 18.5 19.3
Axle load bin (tonne)
Figure 17. Example of an Axle Load Histogram
Section 4: Design Traffic Estimation
Page 29