
Page 334 - C:\Users\azizu\Documents\Flip PDF Professional\Matematics-Form-1-1\
P. 334
Self Practice 12.1e 3. (a) 35 bookings. Bar chart. (b) In Diagram (a), most of the
The difference in room taller bars lie in the middle
1. No, because not all the results bookings can be obtained of the histogram. It shows
of the survey are shown in the by calculating the difference that most students obtained
bar chart, that is: in length of the bars for the average marks in the
16 + 6 + 12 + 4 , 40
Internet and counter. Science test.
2. No, because the line graph (b) A pie chart because the pie In Diagram (b), most of the
seems to show a rapid change chart shows 48% of the taller bars lie on the
in the temperature every 2 rooms are booked via the right-hand side of the
hours in the day. The scale on Internet and that is almost histogram. It shows that
the vertical axis should start half of the total room most students obtained
at zero so that the information bookings. higher marks in the
displayed will not be confusing. Mathematics test.
(c) A bar chart because the
number of rooms booked (c) More students obtained
Mastery 12.1 higher marks in the
via the Internet can be read
1. (a) –3°C directly from the length of Mathematics test than in the
Science test.
(b) – 4°C the bar for the Internet. For
(c) 1100 and 1700 a pie chart, the number of 6. (a) Shop A and shop B sold
room bookings can only be the same number of lamps,
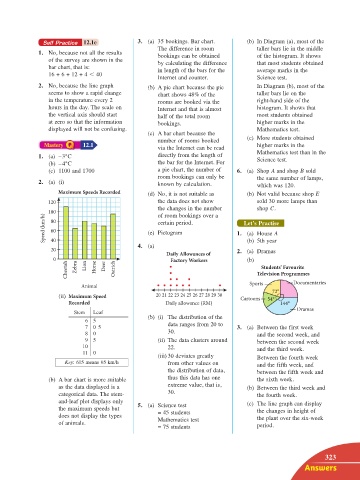
2. (a) (i) known by calculation. which was 120.
Maximum Speeds Recorded (d) No, it is not suitable as (b) Not valid because shop E
120 the data does not show sold 30 more lamps than
the changes in the number shop C.
100 of room bookings over a
Speed (km/h) 80 (e) Pictogram 1. (a) House A
Let’s Practise
certain period.
60
40
4. (a) (b) 5th year
20 2. (a) Dramas
Daily Allowances of
0 Factory Workers (b)
Cheetah Zebra Lion Horse Deer Ostrich Television Programmes
Students’ Favourite
Animal Sports Documentaries
(ii) Maximum Speed 20 21 22 23 24 25 26 27 28 29 30 Cartoons 54° 72°
Recorded Daily allowance (RM) 144°
Dramas
Stem Leaf
(b) (i) The distribution of the
6 5
7 0 5 data ranges from 20 to 3. (a) Between the first week
8 0 30. and the second week, and
9 5 (ii) The data clusters around between the second week
10 22. and the third week.
11 0
(iii) 30 deviates greatly Between the fourth week
Key: 6 | 5 means 65 km/h from other values on and the fifth week, and
the distribution of data, between the fifth week and
(b) A bar chart is more suitable thus this data has one the sixth week.
as the data displayed is a extreme value, that is, (b) Between the third week and
categorical data. The stem- 30. the fourth week.
and-leaf plot displays only (c) The line graph can display
the maximum speeds but 5. (a) Science test the changes in height of
does not display the types = 45 students the plant over the six-week
of animals. Mathematics test period.
= 75 students
323
Answers
14 Ans Math F1.indd 323 11/10/16 12:23 PM