Page 68 - Investing in the Praetura Group
P. 68

68
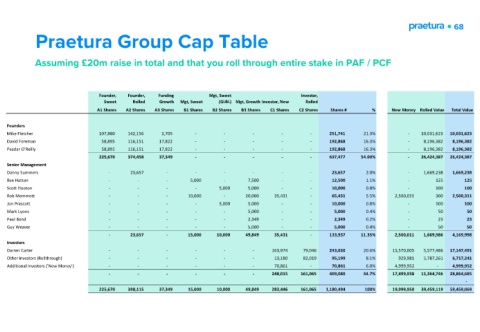
             Praetura Group Cap Table


            Assuming £20m raise in total and that you roll through entire stake in PAF / PCF


                                 Founder,   Founder,   Funding       Mgt, Sweet                    Investor,
                                   Sweet    Rolled   Growth  Mgt, Sweet  (GLBL) Mgt, Growth Investor, New  Rolled
                                 A1 Shares  A2 Shares  A3 Shares  B1 Shares  B2 Shares  B3 Shares  C1 Shares  C2 Shares  Shares #  %  New Money Rolled Value  Total Value

   Founders
   Mike Fletcher                       107,880          142,156               1,705                   -                    -                    -                    -                    -           251,741  21.3%                    -      10,031,623     10,031,623
   David Foreman                          58,895          116,151             17,822                   -                    -                    -                    -                    -           192,868  16.3%                    -        8,196,382       8,196,382
   Peadar O'Reilly                        58,895          116,151             17,822                   -                    -                    -                    -                    -           192,868  16.3%                    -        8,196,382       8,196,382
                                       225,670          374,458             37,349                   -                    -                    -                    -                    -           637,477  54.00%                    -      26,424,387     26,424,387
   Senior Management
   Danny Summers                                -              23,657                   -                    -                    -                    -                    -                    -              23,657  2.0%                    -        1,669,238       1,669,238
   Ben Hatton                                   -                    -                    -                5,000                   -                7,500                   -                    -              12,500  1.1%                    -                   125                  125
   Scott Hooton                                 -                    -                    -                    -                5,000               5,000                   -                    -              10,000  0.8%                    -                   100                  100
   Rob Memmott                                  -                    -                    -              10,000                   -              20,000             35,431                   -              65,431  5.5%        2,500,011                  300       2,500,311
   Jon Prescott                                 -                    -                    -                    -                5,000               5,000                   -                    -              10,000  0.8%                    -                   100                  100
   Mark Lyons                                   -                    -                    -                    -                    -                5,000                   -                    -                5,000  0.4%                    -                     50                    50
   Paul Bond                                    -                    -                    -                    -                    -                2,349                   -                    -                2,349  0.2%                    -                     23                    23
   Guy Weaver                                   -                    -                    -                    -                    -                5,000                   -                    -                5,000  0.4%                    -                     50                    50
                                                -              23,657                   -              15,000             10,000             49,849             35,431                   -           133,937  11.35%        2,500,011       1,669,986       4,169,998
   Investors
   Darren Carter                                -                    -                    -                    -                    -                    -           163,974             79,046          243,020  20.6%      11,570,005       5,577,486     17,147,491
   Other Investors (Rollthrough)                    -                    -                    -                    -                    -                    -              13,180             82,019             95,199  8.1%           929,981       5,787,261       6,717,241
   Additional Investors ('New Money')                    -                    -                    -                    -                    -                    -              70,861                   -              70,861  6.0%        4,999,952                   -        4,999,952
                                                -                    -                    -                    -                    -                    -           248,015          161,065          409,080  34.7%      17,499,938     11,364,746     28,864,685
                                                                                                                                                                    -
                                       225,670          398,115             37,349             15,000             10,000             49,849          283,446          161,065       1,180,494  100%      19,999,950     39,459,119     59,459,069
   63   64   65   66   67   68   69   70   71   72   73