
Page 193 - SUBSEC October 2017_Neat
P. 193
- 4 -
Module I
Answer ALL questions.
Write your answers in the spaces provided in this booklet.
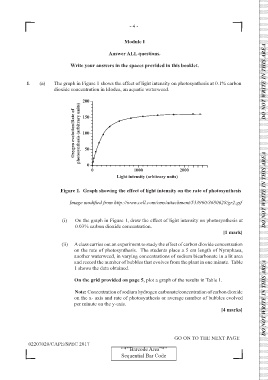
1. (a) The graph in Figure 1 shows the effect of light intensity on photosynthesis at 0.1% carbon DO NOT WRITE IN THIS AREA
dioxide concentration in Elodea, an aquatic waterweed.
150
Oxygen evolution/Rate of photosynthesis (arbitrary units) 200
100
50
0
0 1000 2000
Light intensity (arbitrary units) DO NOT WRITE IN THIS AREA
Figure 1. Graph showing the effect of light intensity on the rate of photosynthesis
Image modified from http://www.cell.com/cms/attachment/533960/3680628/gr2.gif
(i) On the graph in Figure 1, draw the effect of light intensity on photosynthesis at
0.03% carbon dioxide concentration.
[1 mark]
(ii) A class carries out an experiment to study the effect of carbon dioxide concentration
on the rate of photosynthesis. The students place a 5 cm length of Nymphaea,
another waterweed, in varying concentrations of sodium bicarbonate in a lit area
and record the number of bubbles that evolves from the plant in one minute. Table
1 shows the data obtained.
On the grid provided on page 5, plot a graph of the results in Table 1. DO NOT WRITE IN THIS AREA
Note: Concentration of sodium hydrogen carbonate/concentration of carbon dioxide
on the x- axis and rate of photosynthesis or average number of bubbles evolved
per minute on the y-axis.
[4 marks]
GO ON TO THE NEXT PAGE
02207020/CAPE/SPEC 2017
‘‘*’’Barcode Area”*”
Sequential Bar Code