
Page 251 - SUBSEC October 2017_Neat
P. 251
- 6 -
02207032/CAPE/SPEC/KMS 2017
CAPE BIOLOGY
UNIT 2 -- PAPER 032
MARK SCHEME
4 marks from Histogram + 2 marks from graph = 6 marks
UK XS
Question 3. (continued)
(b) Babies of 6 – 7 lbs (which constitute 18% of births) have
the lowest mortality (2.5 and 1.5%).
Babies of 3 – 4 lbs have the highest percentage mortality
of 90%.
Babies of 11 lbs also show high % mortality of 15%.
3 correct points, using data from the table - 3 marks 3
(c) The next generation would receive more genes associated
with mean birth-weight.
Fewer genes for very low, or high birth-weight would be
passed to the next generation.
One correct point – 1 mark 1
(d) Directional
Correct – 1 mark 1
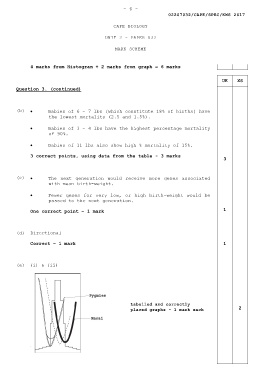
(e) (i) & (ii)
Labelled and correctly
placed graphs -- 1 mark each 2