
Page 586 - SUBSEC October 2017_Neat
P. 586
PRACTICAL ACTIVITIES (cont’d)
THE DISTRIBUTION OF ERRORS IN PHYSICAL MEASURMENTS
Refer to Unit 1, Module 1, Specific Objective 1.7
Aim: To examine how errors are distributed in measurements of a physical quantity.
Method: The experiment is divided into three sections.
A. The Normal Distribution
Attach a plain sheet of paper to the soft board mounted on the wall. Make a suitable mark or marks
on the paper at the level of the middle of the paper. Stand at a distance from the board and throw
darts at the level on the paper where your estimate your eye level to be. According to your throwing
ability several trial throws may be necessary before the most suitable throwing distance is found.
Make a total of 100 throws. More than one sheet of paper may be used (if necessary) as long as the
same reference marks are used to position each. Be careful, however, otherwise your graph will be
poor.
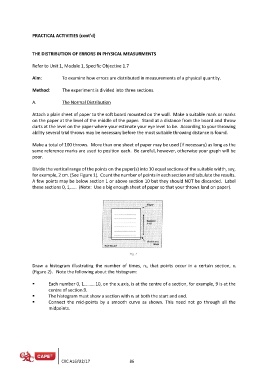
Divide the vertical range of the points on the paper(s) into 10 equal sections of the suitable width, say,
for example, 2 cm. (See Figure 1). Count the number of points in each section and tabulate the results.
A few points may be below section 1 or above section 10 but they should NOT be discarded. Label
these sections 0, 1,….. (Note: Use a big enough sheet of paper so that your throws land on paper).
Draw a histogram illustrating the number of times, ni, that points occur in a certain section, xi
(Figure 2). Note the following about the histogram:
Each number 0, 1……….10, on the xi axis, is at the centre of a section, for example, 9 is at the
centre of section 9.
The histogram must show a section with ni at both the start and end.
Connect the mid-points by a smooth curve as shown. This need not go through all the
midpoints.
CXC A16/U2/17 86