
Page 587 - SUBSEC October 2017_Neat
P. 587
PRACTICAL ACTIVITIES (cont’d)
Random errors should cause the histogram to approximately follow a bell-shaped curve called the
Normal Distribution.
Now calculate the mean value of the measurements, X, using the formula:
X = ni xi where N=total number of points and xi can have 1 – 10. Mark the mean value X
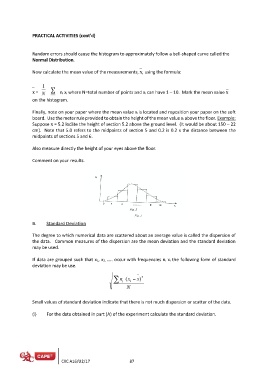
on the histogram.
Finally, note on your paper where the mean value xi is located and reposition your paper on the soft
board. Use the meter rule provided to obtain the height of the mean value xi above the floor. Example:
Suppose X = 5.2 locate the height of section 5.2 above the ground level. (It would be about 150 – 22
cm). Note that 5.0 refers to the midpoints of section 5 and 0.2 is 0.2 x the distance between the
midpoints of sections 5 and 6.
Also measure directly the height of your eyes above the floor.
Comment on your results.
B. Standard Deviation
The degree to which numerical data are scattered about an average value is called the dispersion of
the data. Common measures of the dispersion are the mean deviation and the standard deviation
may be used.
If data are grouped such that x1, x2, ….. occur with frequencies ni xi the following form of standard
deviation may be use.
Small values of standard deviation indicate that there is not much dispersion or scatter of the data.
(i) For the data obtained in part (A) of the experiment calculate the standard deviation.
CXC A16/U2/17 87