
Page 7 - Trends - Labour + Ind Relations 2017 - Vol 3
P. 7
SECTION 1 ECONOMIC ENVIRONMENT
Table 1: KEY ECONOMIC INDICATORS
SELECTED ECONOMIC INDICATORS 2013 2014 2015 2016
Real GDP Growth (%) 2.7 -0.6 -0.6 -2.3
GDP Per Capita (US$) 19.67 20.19 18.14 16.72
Headline Inflation (% end-of-period) 5.6 8.5 1.5 3.1
Government Revenue (TT$Bn) 52.8 58.4 57.2 45.0
Government Expenditure (TT$Bn) 57.7 62.8 59.9 52.2
Exchange Rates (end-of-period): (TT$/US$) 6.4426 6.4086 6.3776 6.6715
Net Official Reserves (US$Mn) 10,175.9 11,497.1 9,933.0 9,465.8
Net Official Reserves (in months import cover) 12.2 12.9 11.2 10.5
Source: Central Bank of Trinidad & Tobago, Central Statistical Office of Trinidad and Tobago (CSO)
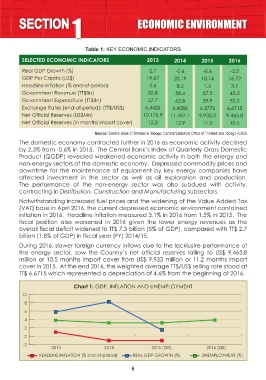
The domestic economy contracted further in 2016 as economic activity declined
by 2.3% from -0.6% in 2015. The Central Bank’s Index of Quarterly Gross Domestic
Product (QGDP) revealed weakened economic activity in both the energy and
non-energy sectors of the domestic economy. Depressed commodity prices and
downtime for the maintenance of equipment by key energy companies have
affected investment in the sector as well as oil exploration and production.
The performance of the non-energy sector was also subdued with activity,
contracting in Distribution, Construction and Manufacturing subsectors.
Notwithstanding increased fuel prices and the widening of the Value Added Tax
(VAT) base in April 2016, the current depressed economic environment contained
inflation in 2016. Headline inflation measured 3.1% in 2016 from 1.5% in 2015. The
fiscal position also worsened in 2016 given the lower energy revenues as the
overall fiscal deficit widened to TT$ 7.3 billion (5% of GDP), compared with TT$ 2.7
billion (1.8% of GDP) in fiscal year (FY) 2014/15.
During 2016, slower foreign currency inflows due to the lacklustre performance of
the energy sector, saw the Country’s net official reserves falling to US$ 9,465.8
million or 10.5 months import cover from US$ 9,933 million or 11.2 months import
cover in 2015. At the end 2016, the weighted average TT$/US$ selling rate stood at
TT$ 6.6715 which represented a depreciation of 4.6% from the beginning of 2016.
Chart 1: GDP, INFLATION AND UNEMPLOYMENT
10
8
6
4
2
0
-2
2013 2014 2015 (QIII) 2016 (QII)
HEADLINE INFLATION (% end-of-period) REAL GDP GROWTH (%) UNEMPLOYMENT (%)
6