
Page 8 - Trends - Labour + Ind Relations 2017 - Vol 3
P. 8
SECTION 2 LABOUR MARKET TRENDS
Table 2: LABOUR MARKET STATISTICS
LABOUR STATISTICS 2013 2014 2015 2016 (QII)
Non-Institutional Population (15 years and over) 1,059.6 1,063.4 1,065.1 1067.3
(‘000s)
Labour Force (‘000s) 650.2 658.6 645.3 641.9
Persons With Jobs (‘000s) 626.3 636.9 623.3 617.8
Persons Without Jobs (‘000s) 23.9 21.7 22.0 24.1
Participation Rate (%) 61.4 61.9 60.6 60.1
Unemployment Rate (%) 3.7 3.3 3.4 3.8
Productivity Growth/Changes (%) 3.2 1.1 -1.4 -5.4
Source: CSO
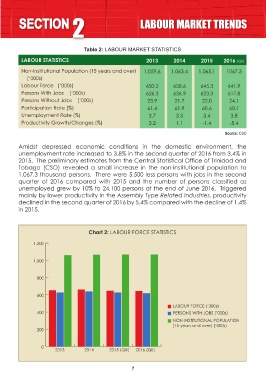
Amidst depressed economic conditions in the domestic environment, the
unemployment rate increased to 3.8% in the second quarter of 2016 from 3.4% in
2015. The preliminary estimates from the Central Statistical Office of Trinidad and
Tobago (CSO) revealed a small increase in the non-institutional population to
1,067.3 thousand persons. There were 5,500 less persons with jobs in the second
quarter of 2016 compared with 2015 and the number of persons classified as
unemployed grew by 10% to 24,100 persons at the end of June 2016. Triggered
mainly by lower productivity in the Assembly Type Related Industries, productivity
declined in the second quarter of 2016 by 5.4% compared with the decline of 1.4%
in 2015.
Chart 2: LABOUR FORCE STATISTICS
1,200
1,000
800
600
LABOUR FORCE (’000s)
400 PERSONS WITH JOBS (’000s)
NON-INSTITUTIONAL POPULATION
(15 years and over) (‘000s)
200
0
2013 2014 2015 (QIII) 2016 (QII)
7