
Page 32 - BAA CAFR 2017
P. 32
BIRMINGHAM AIRPORT AUTHORITY
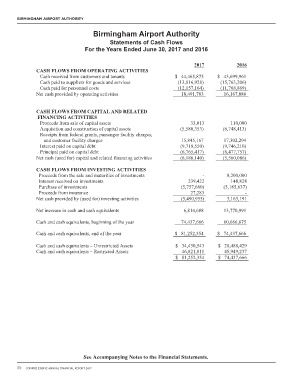
BIRMINGHAM AIRPORT AUTHORITY
STATEMENTS OF CASH FLOWS
STATEMENTS OF NET POSITION
For the years ended June 30, 2017 and 2016
For the years ended June 30, 2017 and 2016
2017 2016
2017 2016
CASH FLOWS FROM OPERATING ACTIVITIES
ASSETS AND DEFERRED OUTFLOWS OF
Cash received from customers and tenants $ 44,465,875 $ 43,699,961
RESOURCES
Cash paid to suppliers for goods and services (13,816,928) (15,763,206)
CURRENT ASSETS
Cash paid for personnel costs (12,157,164) (11,768,869)
Unrestricted Assets:
Net cash provided by operating activities 18,491,783 16,167,886
Cash and cash equivalents $ 34,430,543 $ 28,488,429
Investments 25,926,563 20,168,903
Grants receivable
CASH FLOWS FROM CAPITAL AND RELATED - 876,944
Accounts receivable (net of allowance for
FINANCING ACTIVITIES
uncollectibles of $29,002 and $28,376
Proceeds from sale of capital assets 33,013 110,000
in 2017 and 2016, respectively)
836,648
Acquisition and construction of capital assets (5,580,353) (6,748,413)
1,505,157
Receipts from federal grants, passenger facility charges, 36,676 4,765
Other accounts receivable
and customer facility charges 15,845,167 17,302,294
519,720
Prepaid insurance
468,723
Interest paid on capital debt (9,718,550) (9,746,210)
292,764
249,349
Inventory
Principal paid on capital debt (6,765,417) (6,477,757)
62,042,914
Total unrestricted assets
51,762,270
Net cash (used for) capital and related financing activities (6,186,140) (5,560,086)
Restricted Assets:
Passenger Facility Charges Funds:
CASH FLOWS FROM INVESTING ACTIVITIES
Cash and cash equivalents
1,402,123
Proceeds from the sale and maturities of investments 1,624,848 8,200,000
-
736,515
750,876
Accounts receivable
Interest received on investments 239,422 148,828
Customer Facility Charges Funds:
Purchase of investments (5,757,660) (5,185,637)
Cash and cash equivalents
Proceeds from insurance 15,935,402 15,375,908
27,283
-
669,335
Accounts receivable
606,666
Net cash provided by (used for) investing activities (5,490,955) 3,163,191
Revenue Bond Reserve Funds:
28,827,856
28,545,636
Cash and cash equivalents
Net increase in cash and cash equivalents 6,814,688 13,770,991
Construction Bond Funds:
Cash and cash equivalents, beginning of the year 74,437,666 60,666,675
625,570
433,705
Cash and cash equivalents
Accrued interest receivable 591 770
Cash and cash equivalents, end of the year $ 81,252,354 $ 74,437,666
47,370,218
Total restricted assets
48,165,583
Total current assets 110,208,497 99,132,488
$ 28,488,429
Cash and cash equivalents – Unrestricted Assets $ 34,430,543
Cash and cash equivalents – Restricted Assets 46,821,811 45,949,237
NON-CURRENT ASSETS
$ 81,252,354 $ 74,437,666
Capital assets, net of accumulated depreciation 535,130,387 546,546,871
Total non-current assets 535,130,387 546,546,871
Total assets 645,338,884 645,679,359
DEFERRED OUTFLOWS OF RESOURCES
Deferred refunding 748,721 922,047
Deferred outflow of resources related to pension 12,441,871 16,936,480
Total deferred outflows of resources 13,190,592 17,858,527
TOTAL ASSETS AND DEFERRED OUTFLOWS
OF RESOURCES $ 658,529,476 $ 663,537,886
See Accompanying Notes to the Financial Statements. 11
See Accompanying Notes to the Financial Statements. 14