
Page 11 - Pancake_Supply_Chain_Co-op_Inc._2016_Annual_Report
P. 11
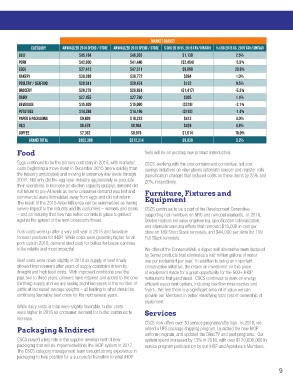
MARKET BASKET
              Category     Annualized 2016 Spend / Store  Annualized 2015 Spend / Store  $ Chg 2016 vs. 2015 Fav/(Unfav)  % Chg 2016 vs. 2015 Fav/(Unfav)
         Beef                     $45,164              $46,303               $1,139                 2.5%
         Pork                     $43,900              $41,446               ($2,454)              -5.9%
         Eggs                     $37,412              $47,311               $9,899                20.9%
         Bakery                   $36,388              $36,772                $384                  1.0%
         Poultry / Seafood        $28,341              $28,474                $132                  0.5%
         Grocery                  $28,278              $26,861               ($1,417)              -5.3%
         Dairy                    $27,455              $27,760                $305                  1.1%
         Beverage                 $15,409              $15,090               ($319)                -2.1%
         Potatoes                 $14,388              $14,196               ($192)                -1.4%
         Paper & Packaging        $9,809               $10,223                $413                  4.0%
         Oils                     $8,478                $8,904                $426                  4.8%
         Coffee                   $7,362                $8,976               $1,614                18.0%
             Grand Total           $302,385             $312,314             $9,930                 3.2%

        Food                                                  feels will be an exciting new product introduction.

        Eggs continued to be the primary cost story in 2016, with markets/  CSCS, working with the cost containment committee, led cost
        costs beginning a move down in December 2015 (more quickly than   savings initiatives on vinyl gloves (alternate source) and register rolls
        the industry anticipated) and moving to extremely low levels through   (specification change) that reduced costs on these items by 25% and
        2016.  Not only did the egg layer industry aggressively re-populate   20%, respectively.
        their operations to increase production capacity (supply), demand did
        not return to pre-AI levels as some consumer demand was lost and   Furniture, Fixtures and
        commercial users formulated away from eggs and did not return.    Equipment
        The result of the 2015 Avian Influenza can be summarized as having
        severe impact to the industry and its customers – winners and losers   CSCS continues to be a part of the Development Committee
        – and an industry that now has better controls in place to protect   supporting our members on NRO and remodel elements.  In 2016,
        against the spread of the next biosecurity threat.    Debbie Hudson led value engineering, specification rationalization,
                                                              and alternate sourcing efforts that removed $16,000 in cost per
        Pork costs were up after a very soft year in 2015 and favorable   store on 189 Short Stack remodels, and $44,000 per store for 119
        forward positions for IHOP.  While costs were generally higher for all   Full Stack remodels.
        pork cuts in 2016, demand (and cost) for bellies for bacon continue
        to be volatile and most impactful.                    We offered the ConserveWell, a dipper well alternative manufactured
                                                              by Server products that eliminates a half million gallons of water
        Beef costs were down slightly in 2016 as supply of beef finally   use per restaurant per year.  In addition to being an important
        showed improvement after years of supply constraint driven by   conservation initiative, the return on investment on this piece
        drought and high feed costs.  With improved conditions over the   of equipment made for a great opportunity for the 600+ IHOP
        past two to three years, growers have retained and added to the cow   restaurants that purchased.  CSCS continues to work on energy
        (birthing) supply and we are seeing slight increases in the number of   efficient equipment options, including low flow rinse nozzles and
        cattle at increased average weights – all leading to what should be   fryers.  We feel there is a significant amount of value we can
        continuing favorable beef costs for the next several years.  provide our Members in better identifying total cost of ownership of
                                                              equipment.
        While dairy costs in total were slightly favorable, butter costs
        were higher in 2016 as consumer demand for butter continues to   Services
        increase.
                                                              CSCS now offers over 30 service programs/offerings.  In 2016, we
        Packaging & Indirect                                  added a UPS package shipping program, launched the new IHOP
                                                              uniform program, and updated the DirecTV and pest programs.  Our
        CSCS played a key role in the supplier development of new   system spend increased by 13% in 2016, with over $170,000,000 in
        packaging that will be implemented into the IHOP system in 2017.    service program participation by our IHOP and Applebee’s Members.
        The CSCS category management team brought strong experience in
        packaging to help position for a successful transition to what IHOP


                                                                                                                      9