Page 114 - New Employee Onboarding
P. 114

Confidential and Privileged
                                                                                                                                                                                      For the Audit and Finance Committee's Review
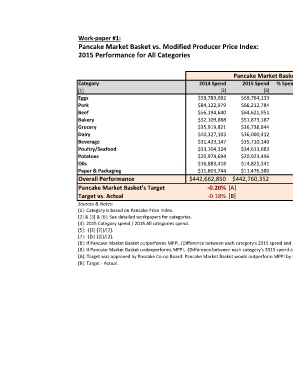


                                  Work-paper #1:
                                  Pancake Market Basket vs. Modified Producer Price Index:

                                  2015 Performance for All Categories


                                                                                                   Pancake Market Basket                                        MPPI                  Advantage Driver
                                  Category                                          2014 Spend        2015 Spend     % Spend 2015    fav/(unfav)   2015 Indexed Spend     fav/(unfav)          fav/(unfav)
                                  [1]                                                        [2]               [3]              [4]           [5]                   [6]           [7]                   [8]
                                  Eggs                                              $59,789,092       $69,764,133           15.8%        -16.7%            $86,296,036        -44.3%                96.2%
                                  Pork                                              $84,122,979       $66,212,784           15.0%         21.3%            $78,281,549          6.9%                70.2%
                                  Beef                                              $56,194,640       $64,621,951           14.6%        -15.0%            $56,301,102         -0.2%                -48.4%
                                  Bakery                                            $52,109,888       $51,873,187           11.7%          0.5%            $52,126,887          0.0%                 1.5%
                                  Grocery                                           $35,919,821       $36,738,844            8.3%          -2.3%           $36,123,698         -0.6%                 -3.6%
                                  Dairy                                             $40,327,103       $36,000,412            8.1%         10.7%            $36,527,136          9.4%                 3.1%
                                  Beverage                                          $31,433,147       $35,710,140            8.1%        -13.6%            $32,133,239         -2.2%                -20.8%
                                  Poultry/Seafood                                   $33,104,324       $34,613,683            7.8%          -4.6%           $33,236,474         -0.4%                 -8.0%
                                  Potatoes                                          $20,974,694       $20,923,496            4.7%          0.2%            $21,023,927         -0.2%                 0.6%
                                  Oils                                              $16,883,418       $14,825,341            3.3%         12.2%            $16,415,064          2.8%                 9.3%
                                  Paper & Packaging                                 $11,803,744       $11,476,380            2.6%          2.8%            $11,475,551          2.8%                 0.0%
                                  Overall Performance                           $442,662,850 $442,760,352                   100%        -0.02%         $459,940,662          -3.90%                 100%
                                  Pancake Market Basket's Target                        -0.20% [A]
                                  Target vs. Actual                                     -0.18% [B]
                                  Sources & Notes:
                                  [1]: Category is based on Pancake Price Index.
                                  [2] & [3] & [6]: See detailed workpapers for categories.
                                  [4]: 2015 Category spend / 2015 All categories spend.
                                  [5]: -{[3]-[2]}/[2].
                                  [7]: -{[5]-[2]}/[2].
                                  [8]: If Pancake Market Basket outperforms MPPI, (Difference between each category's 2015 spend and 2015 index spend/Difference between all categories' 2015 spend and 2015 index spend).
                                  [8]: If Pancake Market Basket underperforms MPPI, -(Difference between each category's 2015 spend and 2015 index spend/Difference between all categories' 2015 spend and 2015 index spend).
                                  [A]: Target was approved by Pancake Co-op Board: Pancake Market Basket would outperform MPPI by 3.7%.
                                  [B]: Target - Actual.
   109   110   111   112   113   114   115   116   117   118   119