
Page 11 - Apple Supply Chain Co-op Inc. 2016 Annual Report.
P. 11
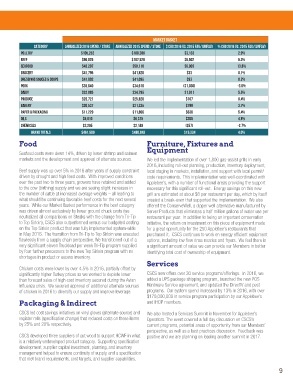
MARKET BASKET
               Category     Annualized 2016 Spend / Store  Annualized 2015 Spend / Store  $ Chg 2016 vs. 2015 Fav/(Unfav)  % Chg 2016 vs. 2015 Fav/(Unfav)
          Poultry                  $105,252             $108,386              $3,133                 2.9%
          Beef                     $96,026              $102,528              $6,502                 6.3%
          Seafood                  $43,207              $50,110               $6,903                13.8%
          Grocery                  $41,795              $41,828                $33                   0.1%
          Dressings Sauces & Soups  $41,002             $41,095                $93                   0.2%
          Pork                     $35,640              $34,610               ($1,030)              -3.0%
          Dairy                    $32,885              $34,795               $1,911                 5.5%
          Produce                  $25,721              $25,828                $107                  0.4%
          Bakery                   $20,537              $21,335                $799                  3.7%
          Paper & Packaging        $11,229              $11,866                $636                  5.4%
          Oils                      $6,010               $6,315                $305                  4.8%
          Chemicals                 $2,205               $2,148                ($57)                -2.7%
              Grand Totals          $461,509             $480,843              $19,334               4.0%
         Food                                                 Furniture, Fixtures and

         Seafood costs were down 14%, driven by lower shrimp and salmon   Equipment
         markets and the development and approval of alternate sources.   We led the implementation of over 1,800 gas-assist grills in early
                                                              2016, including roll-out planning, production, inventory deployment,
         Beef supply was up over 5% in 2016 after years of supply constraint   local staging in markets, installation, and support with local permit/
         driven by drought and high feed costs.  With improved conditions   code requirements.  This implementation was well-coordinated with
         over the past two to three years, growers have retained and added   Applebee’s, with a number of functional areas providing the support
         to the cow (birthing) supply and we are seeing slight increases in   necessary for this significant roll-out.  Energy savings on this new
         the number of cattle at increased average weights – all leading to   grill are estimated at about $8 per restaurant per day, which by itself
         what should be continuing favorable beef costs for the next several   created a break-even that supported the implementation.  We also
         years.  While our Market Basket performance in the beef category   offered the ConserveWell, a dipper well alternative manufactured by
         was driven almost exclusively by lower ground chuck costs (we   Server Products that eliminates a half million gallons of water use per
         neutralized all comparisons on Steaks with the change from Tri-Tip   restaurant per year.  In addition to being an important conservation
         to Top Sirloin), CSCS also outperformed versus our budgeted costing   initiative, the return on investment on this piece of equipment made
         on the Top Sirloin product that was fully implemented system-wide   for a great opportunity for the 250 Applebee’s restaurants that
         in May 2016.  The transition from Tri-Tip to Top Sirloin was executed   purchased it.  CSCS continues to work on energy efficient equipment
         flawlessly from a supply chain perspective. We transitioned out of a   options, including low flow rinse nozzles and fryers.  We feel there is
         very significant eleven Truckload per week Tri-Tip program supplied   a significant amount of value we can provide our Members in better
         by four further processors to the new Top Sirloin program with no   identifying total cost of ownership of equipment.
         shortages in product or excess inventory.
                                                              Services
         Chicken costs were lower by over 4.5% in 2016, partially offset by
         significantly higher Turkey prices as we worked to deplete lower   CSCS now offers over 30 service programs/offerings.  In 2016, we
         than forecast sales of high cost inventory secured during the Avian   added a UPS package shipping program, launched the new POS
         Influenza crisis.  We secured approval of additional alternate sources   Hardware Service agreement, and updated the DirecTV and pest
         of chicken in 2016 to diversify our supply and improve leverage.  programs.  Our system spend increased by 13% in 2016, with over
                                                              $170,000,000 in service program participation by our Applebee’s
         Packaging & Indirect                                 and IHOP members.

         CSCS led cost savings initiatives on vinyl gloves (alternate source) and   We also hosted a Services Summit in November for Applebee’s
         register rolls (specification change) that reduced costs on these items   Operators. The event covered a full day discussion on CSCS’s
         by 25% and 20% respectively.                         current programs, potential areas of opportunity from our Members’
                                                              perspective, as well as a best practices discussion.  Feedback was
         CSCS developed three suppliers of cut wood to support HCWF in what   positive and we are planning on leading another summit in 2017.
         is a relatively undeveloped product category.  Supporting specification
         development, supplier capital investment, planning, and inventory
         management helped to ensure continuity of supply, and a specification
         that met brand requirements, cost targets, and supplier capabilities.

                                                                                                                      9