
Page 323 - Onboarding May 2017
P. 323
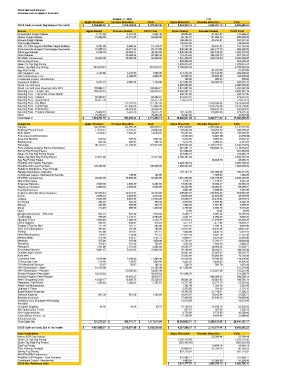
CSCS Net Cash Position
(Includes cash in Apple & Pancake)
October 31, 2016 YTD
Apple Allocation Pancake Allocation Total Apple Allocation Pancake Allocation Total
CSCS Cash on Hand, Beginning of the month $ 3,264,459.52 $ 1,916,764.83 $ 5,181,224.35 $ 3,254,309.13 $ 2,034,091.10 $ 5,288,400.23
Source Apple Related Pancake Related CSCS Total Apple Related Pancake Related CSCS Total
Arrowstream Freight Rebate 2,171.65 3,781.83 5,953.48 90,095.80 51,991.07 142,086.87
Glazier Freight Rebate 15,986.00 34,014.00 50,000.00 62,103.27 137,896.73 200,000.00
McLane Freight Rebate - 489,298.54 65,232.81 554,531.35
FSA Freight Rebate - 146,623.95 146,623.95
USF, ITI, PFG Sygma Charlotte Freight Rebates 5,254.05 6,865.32 12,119.37 41,722.75 59,461.57 101,184.32
Price Variance Analysis Overcharges Recovered 10,905.16 12,271.92 23,177.08 536,265.30 432,217.79 968,483.09
Patronage Rebates 6,938.78 42,283.91 49,222.69 1,045,256.30 562,019.28 1,607,275.58
Other Rebates 25,360.44 25,360.44 119,473.22 338,259.70 457,732.92
NFC/RBC Conferences 26,850.00 30,000.00 56,850.00 1,081,400.00 945,150.00 2,026,550.00
Shrimp Peg Pricing - 893,508.60 893,508.60
Steak (Tri Tip) Peg Pricing - 1,376,914.47 1,376,914.47
Steak (Top Butt) Peg Pricing 901,815.91 901,815.91 2,799,545.34 2,799,545.34
Egg Peg Pricing - 61,272.05 61,272.05
HAVI Supplier Fees 4,125.00 3,375.00 7,500.00 210,375.00 172,125.00 382,500.00
HAVI Connectivity Fees 4,000.00 4,000.00 67,000.00 65,000.00 132,000.00
Contributed Capital - Membership - 100.00 800.00 900.00
Equipment Rebates 5,073.73 2,055.35 7,129.08 317,902.05 132,605.70 450,507.75
Wood Fire Grill Loan - 2,900,000.00 2,900,000.00
Wood Fire Grill Loan Payments from DC's 183,964.17 183,964.17 1,931,887.04 1,931,887.04
Sourcing Fees - French Fries 184,312.16 184,312.16 2,482,907.19 2,482,907.19
Sourcing Fees - 7 and 9 Oz. House Sirloin - 248,737.06 248,737.06
Sourcing Fees - Chicken 68,400.81 68,400.81 979,615.07 979,615.07
Sourcing Fees - Ground Beef 65,477.70 65,477.70 779,573.70 779,573.70
Sourcing Fees - Dry Mixes 212,707.95 212,707.95 2,473,594.04 2,473,594.04
Sourcing Fees - Liquid Eggs 157,636.68 157,636.68 2,378,756.06 2,378,756.06
Sourcing Fees - Hashbrowns 44,354.34 44,354.34 446,443.56 446,443.56
Sourcing Fees - Produce (Danaco) 23,468.18 5,947.60 29,415.78 262,739.80 116,885.66 379,625.46
Other 29,958.48 29,958.48 33,597.00 - 33,597.00
Total Cash In $ 1,534,701.78 $ 584,654.34 $ 2,119,356.12 $ 18,896,641.45 $ 8,439,711.02 $ 27,336,352.47
Categories Apple Allocation Pancake Allocation Total Apple Allocation Pancake Allocation Total
Salaries 132,785.46 132,785.45 265,570.91 2,556,890.65 2,556,890.64 5,113,781.29
Employer Payroll Taxes 11,512.21 11,512.21 23,024.42 168,252.84 168,252.82 336,505.66
401K Match 7,332.43 7,332.43 14,664.86 83,267.92 83,267.93 166,535.85
FSA Account Administration - (3,025.00) (3,025.00) (6,050.00)
Executive Benefits 528.53 528.53 1,057.06 8,028.09 8,028.09 16,056.18
Banking Fees 597.32 288.01 885.33 4,212.78 2,269.09 6,481.87
Patronage 96,118.31 31,155.97 127,274.28 2,268,563.92 2,159,914.67 4,428,478.59
Price Variance Analysis Paid to Franchisees - 501,801.41 609,052.13 1,110,853.54
Shrimp Peg Pricing Payout - 261,060.00 - 261,060.00
Steak (Tri Tip) Peg Pricing Payout - 318,205.77 - 318,205.77
Steak (Top Butt) Peg Pricing Payout 31,914.68 31,914.68 3,462,481.29 - 3,462,481.29
Egg Peg Pricing Payout - - 36,658.45 36,658.45
Woodfire Grill Vendor Payments - 3,303,798.53 - 3,303,798.53
Woodfire Grill Loan Payments 195,588.80 195,588.80 1,982,693.05 1,982,693.05
Rebate to Distributors - Pass Through - - - -
Rebates Refunded to Operators - 175,154.47 231,089.58 406,244.05
Contributed Capital - Membership Refunds 100.00 100.00 - 1,300.00 1,300.00
NFC/RBC Conferences 26,850.00 30,000.00 56,850.00 1,081,400.00 945,150.00 2,026,550.00
New Office Space - 1,710.71 1,710.71 3,421.42
Employee Relations 2,600.30 2,600.29 5,200.59 10,003.36 10,003.27 20,006.63
Restaurant Visitation 2,668.02 2,668.03 5,336.05 29,202.90 29,202.91 58,405.81
Training Expenses - 3,681.00 3,680.99 7,361.99
Employee Benefits-Group Insurance 22,372.42 22,372.41 44,744.83 226,823.37 226,823.32 453,646.69
Airfare 2,035.24 2,643.58 4,678.82 23,666.09 24,404.89 48,070.98
Lodging 6,526.38 6,807.47 13,333.85 23,538.10 25,435.64 48,973.74
Car Rental 344.22 344.22 688.44 2,579.04 2,647.06 5,226.10
Mileage 226.88 206.90 433.78 1,908.82 1,951.05 3,859.87
Meals 712.49 608.36 1,320.85 4,783.02 4,952.18 9,735.20
Other - 12.55 12.54 25.09
Meals/Entertainment - 50% Ded 527.16 547.46 1,074.62 5,325.71 5,381.33 10,707.04
Taxi/Parking 690.29 1,313.71 2,004.00 3,841.37 4,998.85 8,840.22
Glendale Travel 1,869.40 1,869.39 3,738.79 31,919.14 31,919.09 63,838.23
Office Supplies 458.32 458.31 916.63 7,477.16 7,477.06 14,954.22
Postage / Express Mail 117.29 187.77 305.06 1,852.25 2,240.74 4,092.99
Dues and Subscriptions 392.04 392.04 784.08 24,015.82 24,015.80 48,031.62
Printing 161.08 161.07 322.15 1,883.00 3,436.13 5,319.13
Other Miscellaneous 110.81 110.80 221.61 12,912.64 4,842.76 17,755.40
Meeting Meals 616.38 616.37 1,232.75 6,930.57 6,873.43 13,804.00
Meetings 525.00 525.00 1,050.00 16,783.82 17,256.22 34,040.04
Recruiting 373.43 373.42 746.85 1,542.24 1,542.23 3,084.47
Relocation 1,101.00 1,101.00 2,202.00 20,964.37 20,964.34 41,928.71
Accounting Services 5,041.67 5,041.66 10,083.33 50,166.69 50,166.61 100,333.30
Outside Legal Counsel - 28,941.88 27,355.87 56,297.75
Audit fees - 35,084.00 35,084.00 70,168.00
Consultant Fees 5,650.00 5,650.00 11,300.00 56,949.00 53,546.00 110,495.00
IT Recurring Costs 519.98 519.97 1,039.95 9,448.47 9,448.45 18,896.92
IT Professional Services 52.67 52.67 105.34 526.70 526.70 1,053.40
HAVI Subscription - Apple 64,195.00 64,195.00 611,359.00 - 611,359.00
HAVI Subscription - Pancake 53,855.00 53,855.00 - 513,521.00 513,521.00
Produce Program Fees-Apple 93,218.63 93,218.63 421,500.76 - 421,500.76
Produce Program Fees-Pancake 46,072.87 46,072.87 - 200,500.24 200,500.24
Rent / Occupancy Costs 12,629.77 12,629.75 25,259.52 99,881.09 99,881.05 199,762.14
Telephone / Cell Phone 1,383.63 1,383.61 2,767.24 13,777.20 13,777.12 27,554.32
Repair and Maintenance - 1,782.49 1,782.49 3,564.98
Licenses & Taxes - 2,379.56 794.56 3,174.12
Board/Director Expenses - 19,456.70 21,749.61 41,206.31
Software Expense 891.30 891.30 1,782.60 10,912.87 10,912.84 21,825.71
Business Insurance - 27,446.50 27,446.50 54,893.00
Donations from Employee Withholding - 13,516.08 - 13,516.08
Penalties - - - -
Computer Supplies 34.69 34.68 69.37 16,168.18 16,168.12 32,336.30
Dist Optimization-Travel - 667.57 667.56 1,335.13
Havi Implementation - 9,775.00 9,775.00 19,550.00
Federal/State Income Tax - 17,180.00 4,400.00 21,580.00
Interest Expense - - - -
Total Cash Out 731,273.23 $ 385,741.71 $ 1,117,014.94 $ 18,083,062.51 $ 8,358,124.66 $ 26,441,187.17
CSCS Cash on Hand, End of the month $ 4,067,888.07 $ 2,115,677.46 $ 6,183,565.53 $ 4,067,888.07 $ 2,115,677.46 $ 6,183,565.53
Cash Restrictions Apple Allocation Pancake Allocation Total
Maines $.07 Case Rebate 25,360.44 25,360.44
Steak (Tri Tip) Peg Pricing 1,165,113.56 1,165,113.56
Steak (Top Butt) Peg Pricing (662,935.95) (662,935.95)
Egg Peg Pricing 13,484.74 13,484.74
Price Variance Analysis 35,009.10 51,754.13 86,763.23
Shrimp Peg Pricing 837,713.62 837,713.62
NFC/RBC/BIM Conferences - - -
Woodfire Grill Program - Loan Proceeds 375,409.77 375,409.77
Contributed Capital - Membership 3,400.00 32,500.00 35,900.00
CSCS Non Restricted Cash $ 2,314,177.97 $ 1,992,578.15 $ 4,306,756.12