
Page 13 - Module 13 japanese Candlesticks
P. 13
Module 13 – A-Z of Japanese Candlesticks
Hammer
The Hammer candlestick formation is a significant bullish reversal candlestick pattern that mainly
occurs at the bottom of downtrends.
The Hammer formation is created when the open, high, and close are roughly the same price. Also,
there is a long lower shadow, twice the length as the real body.
When the high and the close are the same, a bullish Hammer candlestick is formed and it is
considered a stronger formation because the bulls were able to reject the bears completely plus the
bulls were able to push price even more past the opening price.
In contrast, when the open and high are the same, this Hammer formation is considered less bullish,
but nevertheless bullish. The bulls were able to counteract the bears, but were not able to bring the
price back to the price at the open.
The long lower shadow of the Hammer implies that the market tested to find where support and
demand was located. When the market found the area of support, the lows of the day, bulls began
to push prices higher, near the opening price. Thus, the bearish advance downward was rejected by
the bulls.
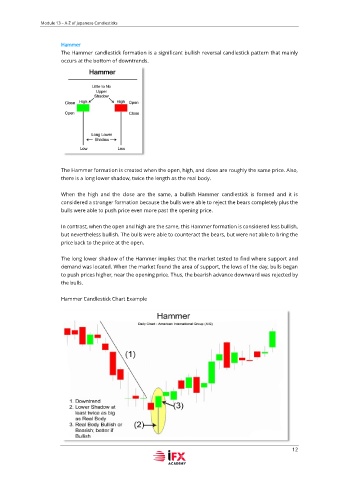
Hammer Candlestick Chart Example
12