
Page 9 - Module 13 japanese Candlesticks
P. 9
Module 13 – A-Z of Japanese Candlesticks
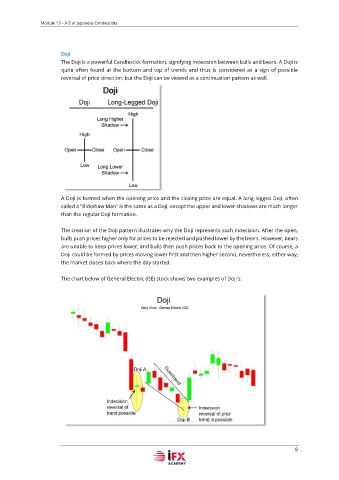
Doji
The Doji is a powerful Candlestick formation, signifying indecision between bulls and bears. A Doji is
quite often found at the bottom and top of trends and thus is considered as a sign of possible
reversal of price direction, but the Doji can be viewed as a continuation pattern as well.
A Doji is formed when the opening price and the closing price are equal. A long-legged Doji, often
called a "Rickshaw Man" is the same as a Doji, except the upper and lower shadows are much longer
than the regular Doji formation.
The creation of the Doji pattern illustrates why the Doji represents such indecision. After the open,
bulls push prices higher only for prices to be rejected and pushed lower by the bears. However, bears
are unable to keep prices lower, and bulls then push prices back to the opening price. Of course, a
Doji could be formed by prices moving lower first and then higher second, nevertheless, either way,
the market closes back where the day started.
The chart below of General Electric (GE) stock shows two examples of Doji's:
8